MIC412TI and MIC412TF Camera Installation and Operation Manual
command is sent. The numeric key pad controls also work whilst in pot test although the learn preset method using the number keys does not.
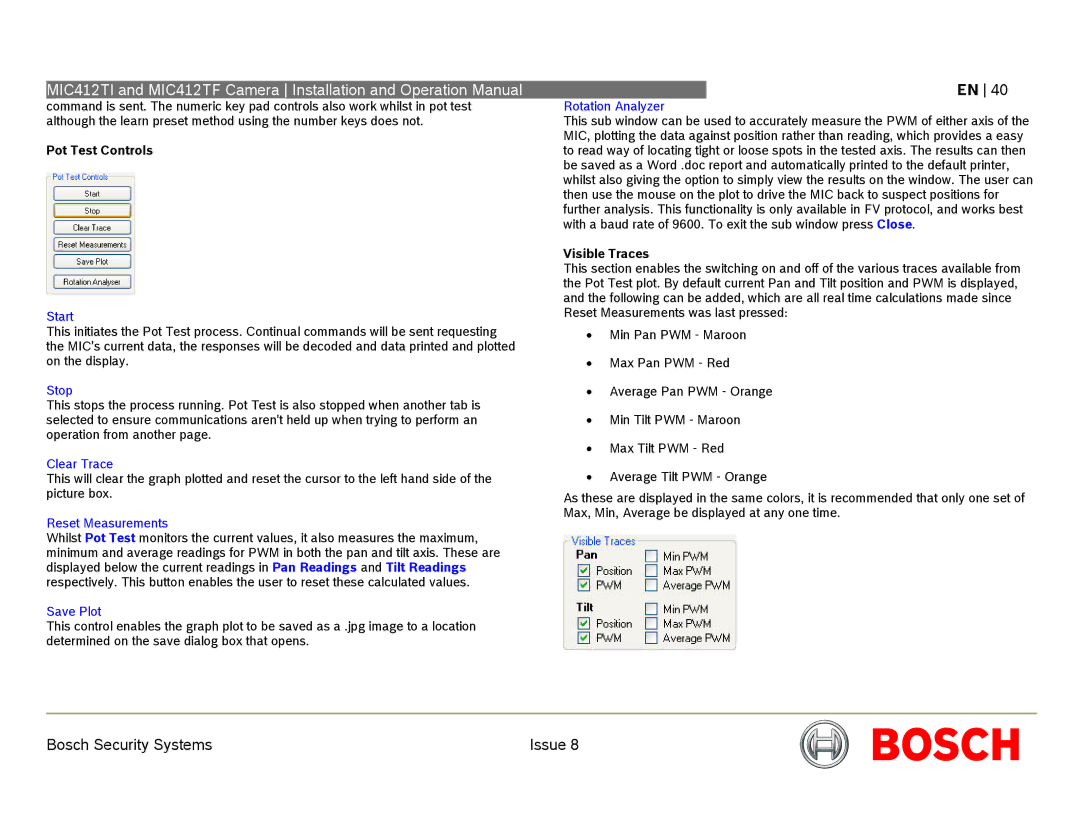
Pot Test Controls
Start
This initiates the Pot Test process. Continual commands will be sent requesting the MIC’s current data, the responses will be decoded and data printed and plotted on the display.
Stop
This stops the process running. Pot Test is also stopped when another tab is selected to ensure communications aren't held up when trying to perform an operation from another page.
Clear Trace
This will clear the graph plotted and reset the cursor to the left hand side of the picture box.
Reset Measurements
Whilst Pot Test monitors the current values, it also measures the maximum, minimum and average readings for PWM in both the pan and tilt axis. These are displayed below the current readings in Pan Readings and Tilt Readings respectively. This button enables the user to reset these calculated values.
Save Plot
This control enables the graph plot to be saved as a .jpg image to a location determined on the save dialog box that opens.
EN 40
Rotation Analyzer
This sub window can be used to accurately measure the PWM of either axis of the MIC, plotting the data against position rather than reading, which provides a easy to read way of locating tight or loose spots in the tested axis. The results can then be saved as a Word .doc report and automatically printed to the default printer, whilst also giving the option to simply view the results on the window. The user can then use the mouse on the plot to drive the MIC back to suspect positions for further analysis. This functionality is only available in FV protocol, and works best with a baud rate of 9600. To exit the sub window press Close.
Visible Traces
This section enables the switching on and off of the various traces available from the Pot Test plot. By default current Pan and Tilt position and PWM is displayed, and the following can be added, which are all real time calculations made since Reset Measurements was last pressed:
•Min Pan PWM - Maroon
•Max Pan PWM - Red
•Average Pan PWM - Orange
•Min Tilt PWM - Maroon
•Max Tilt PWM - Red
•Average Tilt PWM - Orange
As these are displayed in the same colors, it is recommended that only one set of Max, Min, Average be displayed at any one time.
Bosch Security Systems | Issue 8 |