Task
How to Inspect and Interpret Data
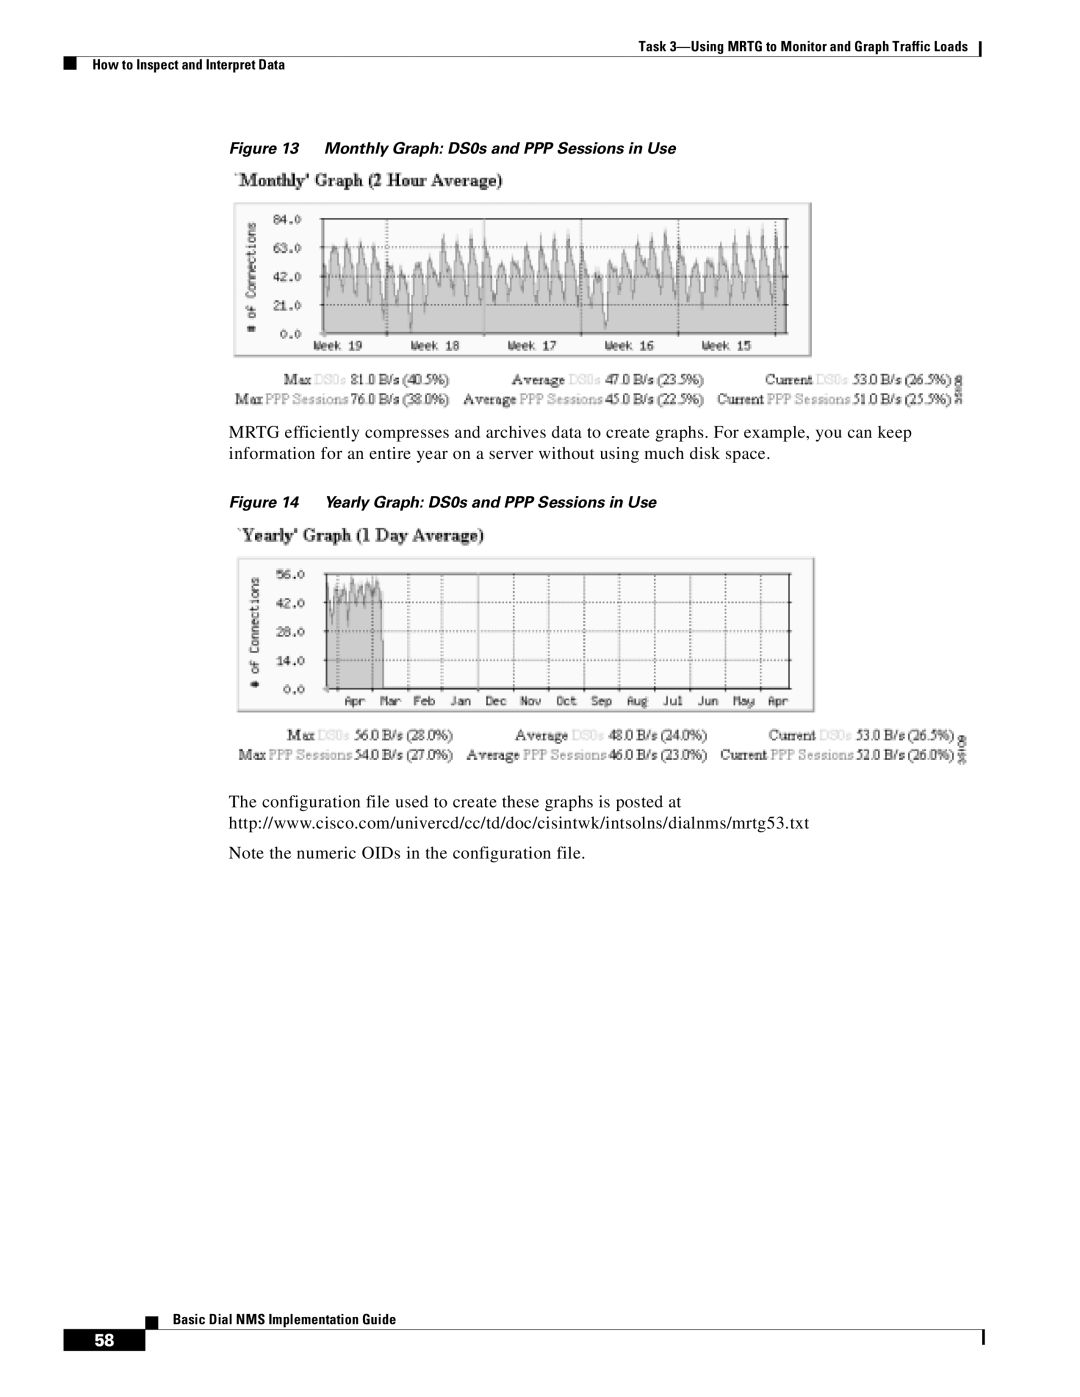
Figure 13 Monthly Graph: DS0s and PPP Sessions in Use
MRTG efficiently compresses and archives data to create graphs. For example, you can keep information for an entire year on a server without using much disk space.
Figure 14 Yearly Graph: DS0s and PPP Sessions in Use
The configuration file used to create these graphs is posted at
http://www.cisco.com/univercd/cc/td/doc/cisintwk/intsolns/dialnms/mrtg53.txt
Note the numeric OIDs in the configuration file.
Basic Dial NMS Implementation Guide
#&
