Task
How to Inspect and Interpret Data
The Connection Success Rate (CSR) is an important metric for tracking and measuring the stability of a dial service. The CSR is defined by the number of modems that successfully train up and go in to connected state. In addition to the CSR, you must track and analyze additional areas. For example, SNMP MIBs can be used to measure the success rate for items such as PPP, AAA, and IP negotiation.
To collect the CSR service level counters, inspect the connection success and failure rate by using modem OIDs or the show modem Cisco IOS command. SNMP, rather than the Cisco IOS CLI, is the preferred method to collect these counters. SNMP can scale to support large numbers of access servers.
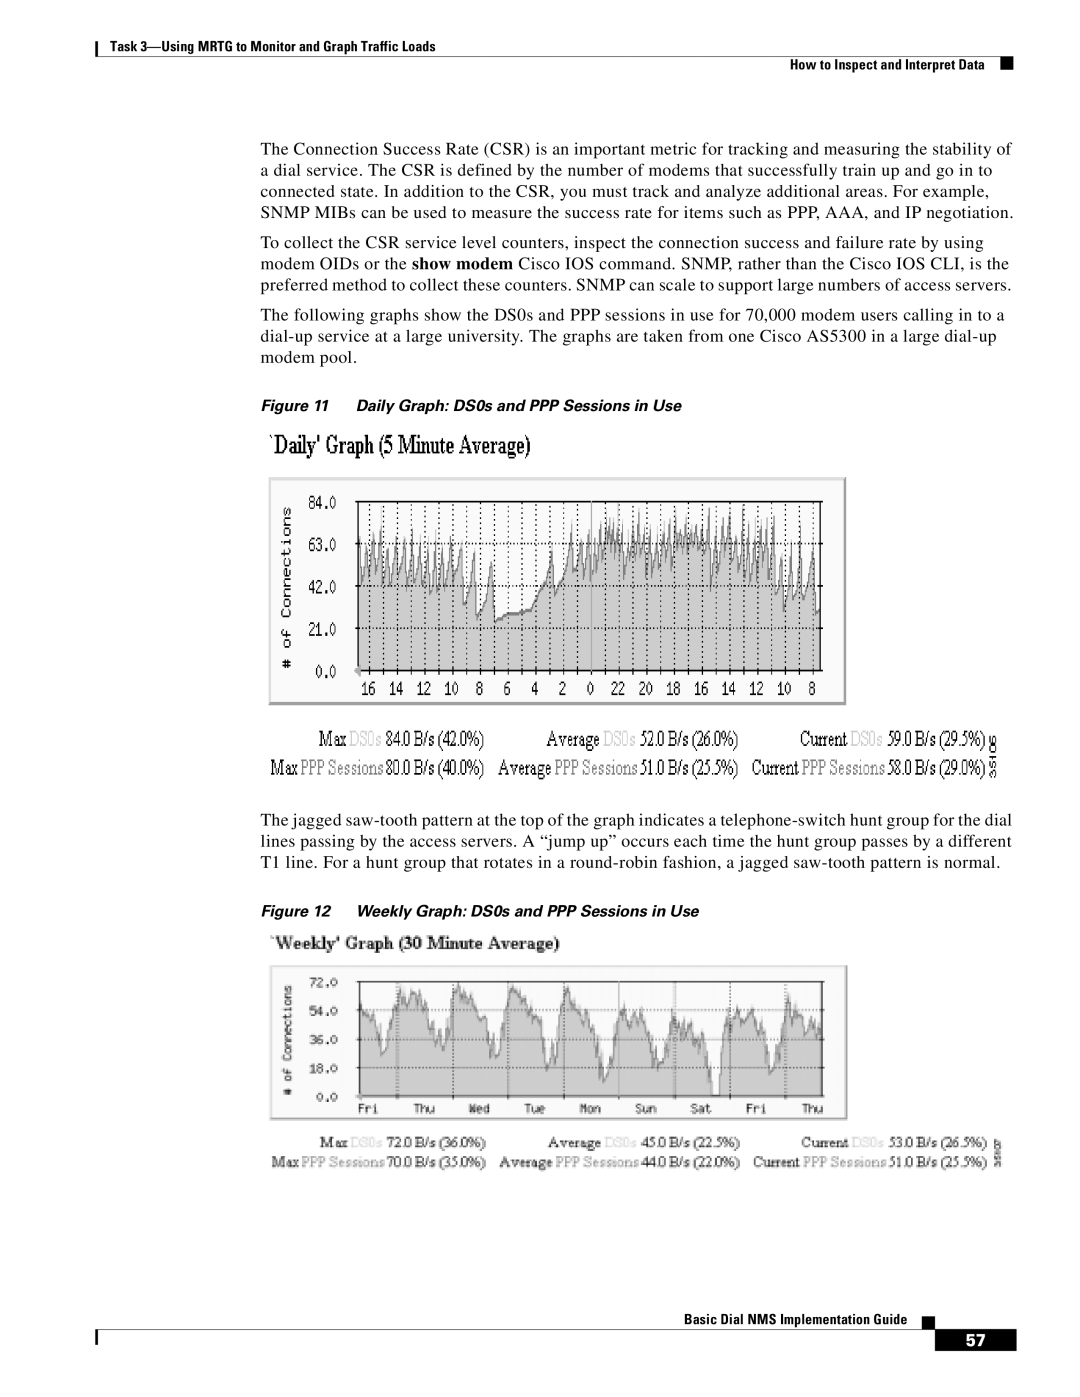
The following graphs show the DS0s and PPP sessions in use for 70,000 modem users calling in to a
Figure 11 Daily Graph: DS0s and PPP Sessions in Use
The jagged
Figure 12 Weekly Graph: DS0s and PPP Sessions in Use
Basic Dial NMS Implementation Guide
#%