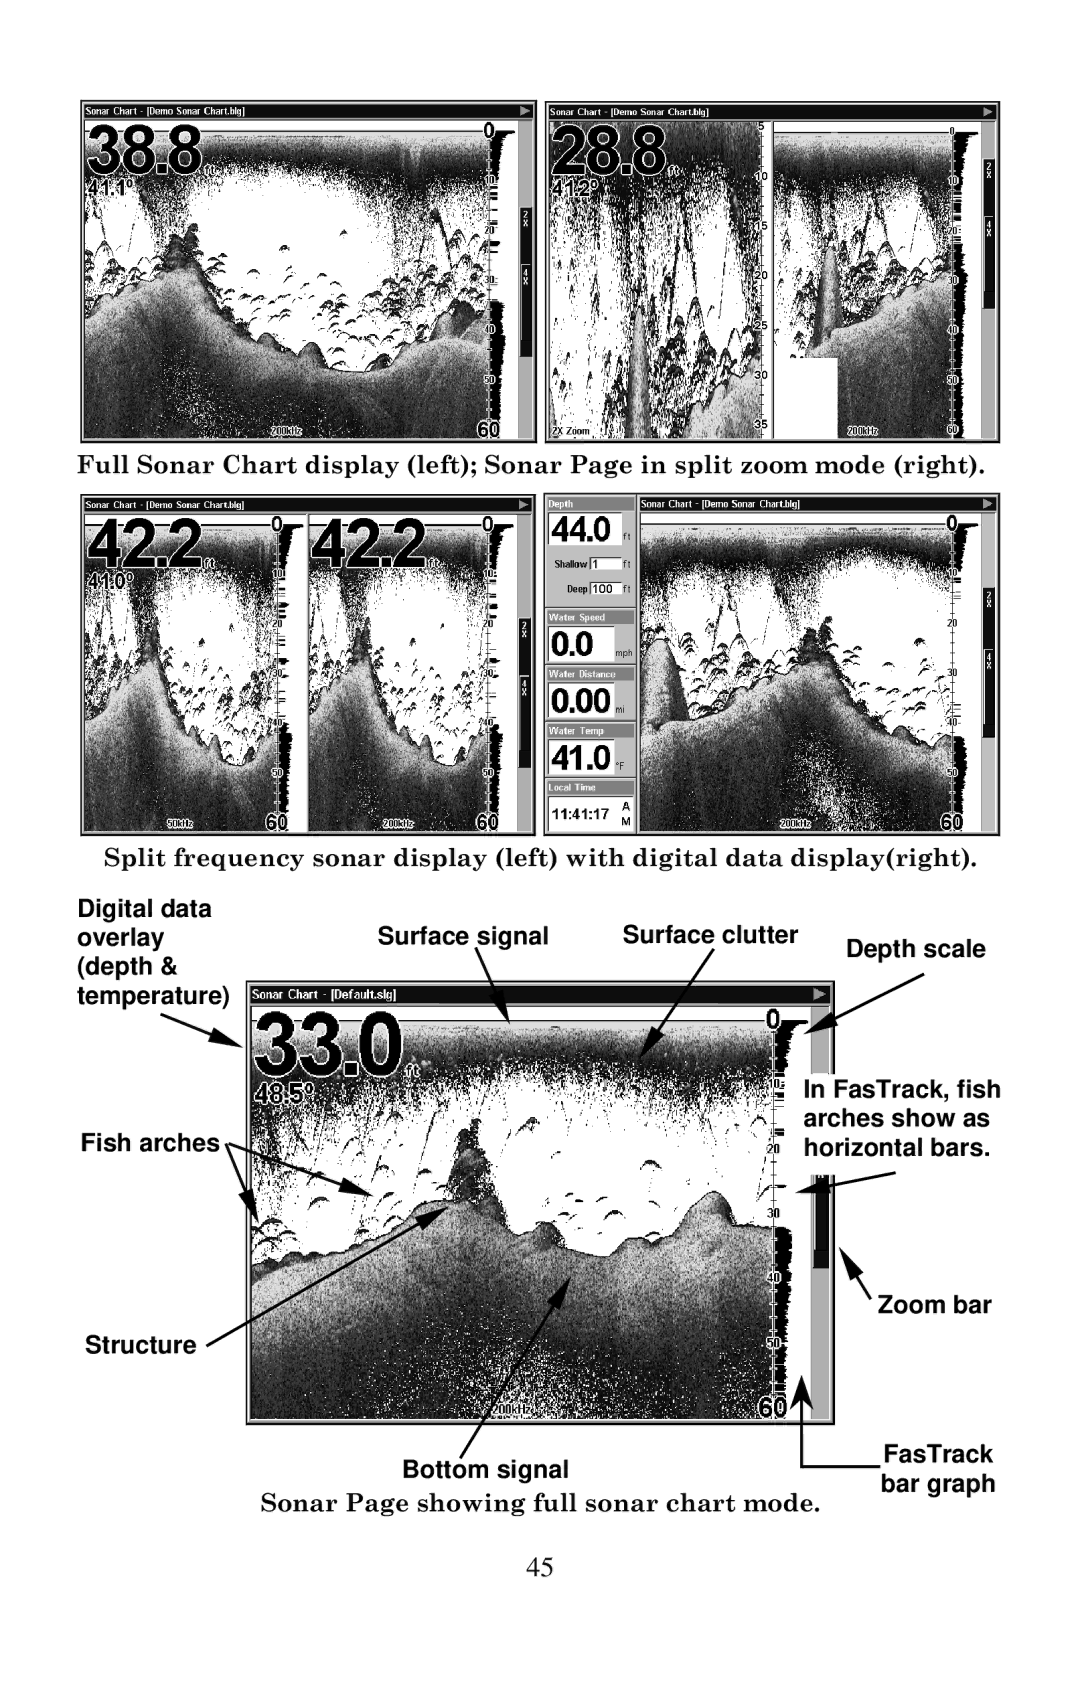
Full Sonar Chart display (left); Sonar Page in split zoom mode (right).
Split frequency sonar display (left) with digital data display(right).
Digital data overlay (depth & temperature)
Fish arches
Structure
Surface signal | Surface clutter | Depth scale |
|
|
In FasTrack, fish arches show as horizontal bars.
Zoom bar
Bottom signal
FasTrack
bar graph
Sonar Page showing full sonar chart mode.
45