Sigma 900 MAX Refrigerated Sampler
Page
Sigma 900 MAX Refrigerated Sampler
Page
Table of Contents
Table of Contents
Table of Contents
114
Safety Precautions
Safety Precautions
Safety Precautions Hazardous Locations
General Dimensions
Temperature Range
Recovery Time
Power Requirements
Sample Bottle Capacity Single Bottle Mode
Multiple Bottle Mode
Sampling Features Multiple Programs
Sample Volume
Factory Installed Options
Alarm Relays
Sensor Dimensions
Rain Gauge Input
General Information
Sensor Dimension
Submerged Area/Velocity Probe Method
Velocity
Depth
Page
Controller Cover
Front Panel
Front Panel
Introduction
Liquid Crystal Display
Section
Keypad Description
Internal Humidity Indicator
Status Bar
Receptacle Caps
Section Interface Connectors
Interface Connectors
Accurate, Repeatable Sample Volumes
Section Principle of Operation
Liquid Sensing
Liquid Sensor
Intake Tube Pre-Rinse
Sample Retry
Installation
Page
Setting Up the Instrument
Installation
Section Installing the Pump Tube in the Sensor Body
Installing the Pump Tube in the Sensor Body
8 Vinyl Tubing Connector
Attaching the Intake Line
Choosing Bottle and Retainer Configurations
Choosing Bottle and Retainer Configurations
Setting Up the Intake Line and Strainer
Setting Up the Bottles
Setting Up the Bottles
One-Bottle Sampling
Two- and Four-bottle Sampling
Eight-, 12-, or 24-bottle Sampling
Two-bottle Locations
Installing the Distributor Multiple Bottle Operation
Installing the Distributor Multiple Bottle Operation
Distributor Arm Alignment
Distributor Tubing in Arm
Power Connections
Full Bottle Shut-off Installation
Auxiliary Receptacle Pin Identification
Splitter Interface
Splitter Interface
Page
Operation
Page
Basic Programming Setup
Initial Power-Up of Sampler
Basic Programming Setup
From the Main Menu select Setupmodify ALL Items
Bottles
Intake Tubing
Program Lock
Section Program Delay
Sample Collection
Timed-Proportional Sampling Intervals
0000 AM
Flow Proportional Constant Volume, Variable Time Cvvt
HrsminCLEAR
Abbreviation Volume
Sampler Pacing Flow Units
1500 gal
Timed OVER-RIDE 0000 hrsmin
Calculation 2 Average Sample Volume
Example
1500 Ml
150.00 gph
Hrsmin
Multiple Bottle Sets
Sample Distribution
Single Bottle
Accept Change RUN Mode Choice RUN Continuously Backup
Disabling the Liquid Sensor/Timed Calibration
Liquid Sensor
Enabling the Liquid Sensor
Sample Retries
Section Sample Volume
Intake Rinses
11-D.If NO, the basic setup program is complete
Section Site ID
Advanced Sampling
11-B.Press Accept
Section Program Complete Output
Setpoint Sampling
00000
000
Special Output
Sampling Triggers and Settings
Channel Sampling Trigger Settings
Start/Stop Times
Bottle Number
Storm Water
Start Condition Requirements
First Flush Bottles
100 mL
Timed Bottle Sets
Duration hhmm
Upset Sample
18-D.Press either High Condition or LOW Condition
0000
Variable Volume
Section Variable Intervals
Temperature Time Constant
Downlook Ultrasonic Sensor
Downlook Ultrasonic Sensor Connection
Downlook Ultrasonic Sensor Programming
Sensor Height
Downlook Ultrasonic Sensor
Submerged Area/Velocity Sensor
Submerged Area/Velocity Sensor Connection
Submerged Area/Velocity Sensor Programming
Submerged/Area Velocity Sensor Connection
From the Main Menu, select Options Advanced Options
Submerged Pressure Sensor
Submerged Pressure Sensor Connection
Pin Signal Description Wire Color
Submerged Pressure Sensor Programming
Submerged Pressure Sensor Calibration
Submerged Level Sensor Base Board Connection J21
Vertical Orientation Only
Horizontal Orientation Only
Page
Rain Gauge
Pin Signal Description
Optional Device Installation
PH Connector Pin Assignments J3
PH Probe
Rain Gauge Programming
PH Probe Connection
From the Main Menu, select Optionsadvanced Optionsdatalog
PH Probe Programming
PH Probe Calibration
ORP Probe
ORP Probe Connection
Change Choice key, then press Accept
ORP Probe
ORP Probe Calibration
ORP Connector Pin Assignments J3
ORP Probe Programming
Dissolved Oxygen Probe
Dissolved Oxygen Probe Connection
Dissolved Oxygen Probe Programming
O. Connections J20
Dissolved Oxygen Probe Calibration
Dissolved Oxygen Probe Temperature Programming
Calibrating the D.O. Temperature
Conductivity Temperature Programming
Conductivity Probe Wiring J20
Section Conductivity Probe
Conductivity Probe Connection
Conductivity Probe Calibration
Solution Calibration Value Temp C To be Entered
Calibrating the Conductivity Temperature
Conductivity Values at Temperature for Hach KCl Solution
RS232 Cable
1 RS232 Connection
2 RS232 Programming
RS232 Connection
Section Modem
Modem Connection
Modem Programming
Modem CPU Connections J8
Installation and Setup
Site Selection
Reliable Communications
Cellular Modem Scheduling Basis
Cellular Scheduling Duration 5 min
Cellular Modem Triggered Duration
30 min
555-5555
Pager ONLY, Pager then MODEM, and Modem then Pager
Pager Alarm Codes
Alarm Code Equipment Reason
Section MA Option
MA Connection
2 4-20 mA Programming
20 mA Connections J18
00 mgd
3 4-20 mA Calibration
MA Input Value
Alarm Relays
Calibration with the Meter in the Loop
Alarm Relays Connection
Relay Connector J17
Connector Relay
Relay Junction Box
Alarm Relays Programming
From the Main Menu, select Setup Advanced Options Alarms
Analog Ch or Conductivity
Deadband
Analog Inputs
Analog Inputs Connection
Analog Input Pin Assignments
Analog Inputs
Analog Inputs Programming
Maintenance
Page
Cleaning the Sampler
Pump Tubing Maintenance
Replacing Pump Tubing
Upgrades, Repairs, General Maintenance
Upgrades, Repairs, General Maintenance
Internal Maintenance Items
Internal Maintenance Items
Section Electrostatic Discharge ESD Considerations
Removing and Opening the Controller
Re-installing the Bottom Panel
Re-installing the Bottom Panel
CPU Board Connectors
Section Circuit Board Identification
CPU Board
Circuit Board Identification
Utility Board
Utility Board Connections
Section Replacing the Fuse
Motor/Gear Box
Internal Desiccant Module
Replacing the Desiccant
Section Memory Battery
Memory Battery
Sigma 900 MAX Refrigerated Sampler Main Menu Flow Chart
Quick Start Guides
See Advanced Sampling Flow Chart
Main Menu
Key
Pick
ORP
Quick Start Guides
Page
Review All Items Screen Contents
Review All Items
Running a Program
Displaying Data
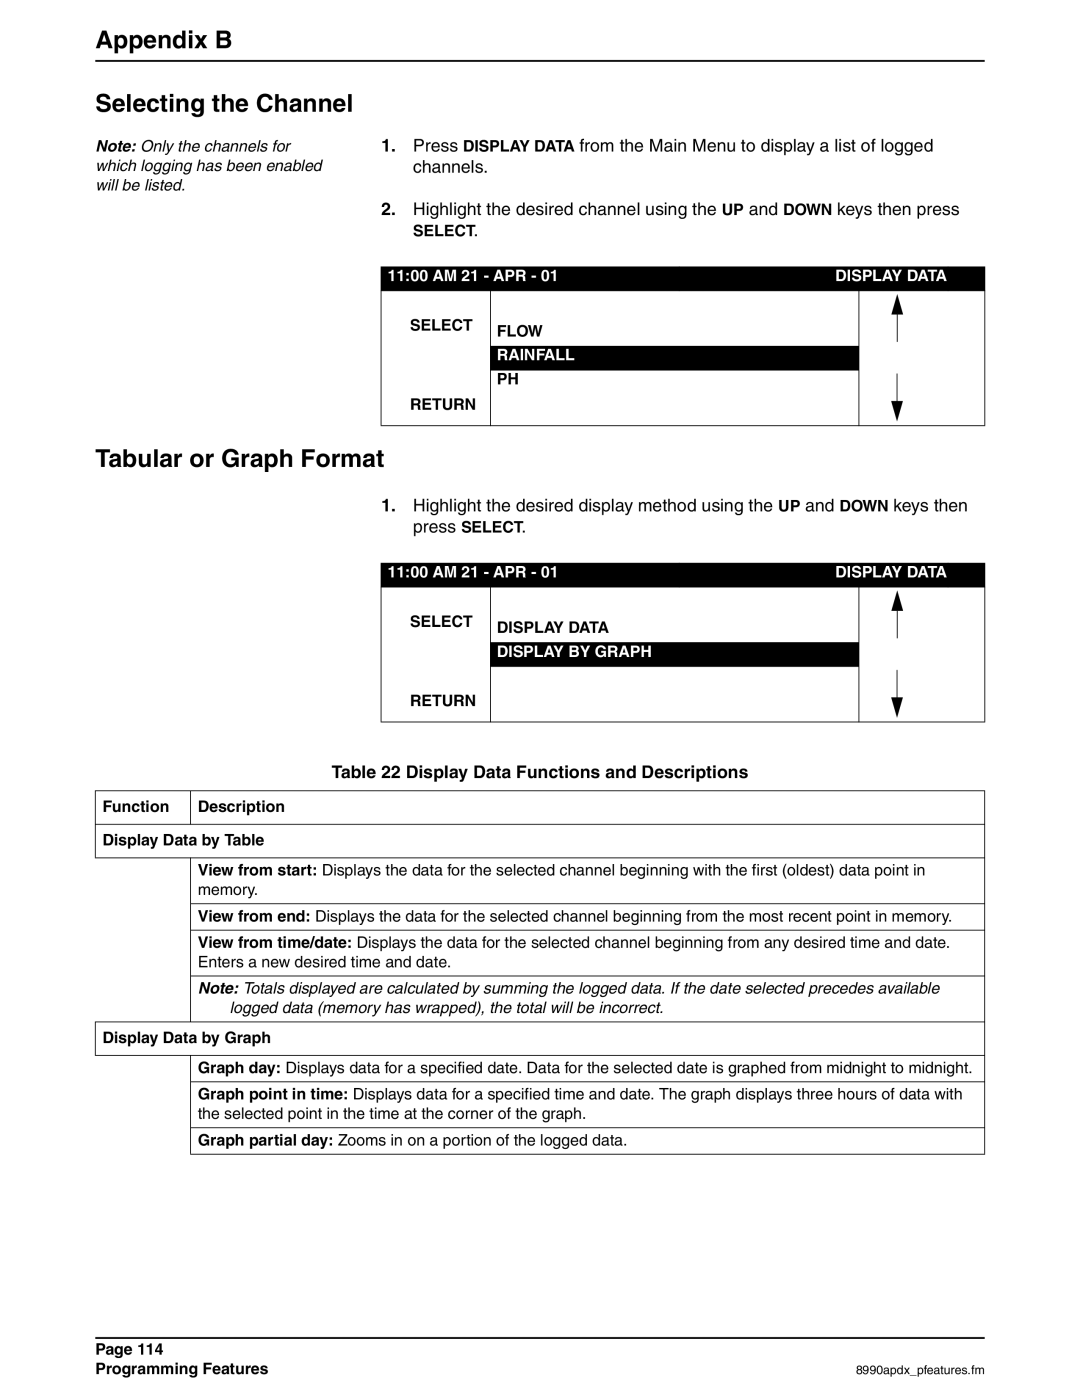
Appendix B Selecting the Channel
Tabular or Graph Format
Display Data Functions and Descriptions
Function Description Display Data by Table
Appendix B Graph Manipulation
Graphic Display Averaging
Sample History
Graphing Functions and Descriptions
Appendix B Options Menu Features
Setting the Time and Date
Volume Calibration
Sensor Disabled
Sensor Enabled
Calibration Volumes
Calibration Procedure-Sensor Disabled
Appendix B
Timed Rinse Calibration Procedure-Sensor Disabled
Calibration Procedure-Sensor Enabled
Power Save Mode
Continuous Mode
Extended Power Mode
Appendix B Data Log
Slate Modem Wrap Mode
Dynamic Memory Allocation
Data Logging Configuration
Diagnostics
Slate Memory Mode
Wrap Memory Mode
Distributor Test
Velocity Analysis
Velocity 7.00 fps
Screen Saver Mode
Battery Power
Ac Power
Appendix B Load Program
Acre-feet Liters Gallons Cubic Feet Cubic Meters
Modify Setup
Appendix B Flow Totalizer
Reset Totalizer
View Totals
Error Messages
Error Message Reason
Troubleshooting and Error Messages
Use RUN/STOP key
Appendix C
Appendix C Trouble Alarm Conditions, Causes, and Solutions
Trouble Condition Cause Solution
Appendix C Downlook Ultrasonic Sensor Troubleshooting
Problems Causes Solutions
Appendix C PH Troubleshooting
Symptom Possible Cause Solution
Problem Cause Solution
Appendix D How to Calculate Pulses/Counts
How to Calculate Pulses/Counts
Intv = Cnts How to Calculate Pulses/Counts
Appendix D
Calculate t
You want to collect 32 samples over an 8-hour period
Exploded Drawings
Sigma 900 MAX Refrigerated Sampler Assembly Drawing 1
Description Quantity Catalog Number
Cat. No Description
Cat. No
AUX
Description Catalog Number
Appendix E Sigma 900 Composite Refrigerator Assembly
Sigma 900 MAX Refrigerated Sampler
Appendix E Sigma 900 Discrete Refrigerator Assembly
Appendix E Transition Tray Assembly
110 cm 43.5 ref
Page
General Information
Page
Parts and Accessories
Description Part Number
Base/Bottle, Composite/Multiple Sampling Accessories
Area x Velocity Measurement Sensors
Depth Measurement Sensors
Sensor Mounting Hardware
Mounting Plate Hardware for Directly Mounting to Pipe Wall
Ultrasonic Sensor Mounting Hardware
Repair Service
Ordering Information for the U.S.A
By Telephone 800 By Fax
Ordering information by E-mail
Germany TCS & Service Germany Ordering Austria
Belgium Denmark Poland
Spain France Italy
Great Britain Netherlands Switzerland
Limitation of Remedies
Warranty
Limitations
Index
Numerics
Eight-, 12-, or 24-bottle Sampling
126