Manuals
/
Intel
/
Home Audio
/
Stereo Receiver
Intel
SBCEFCSW
manual
Managing alarms, Alarm Log Data window, Configuring alarms
Models:
SBCEFCSW
1
117
156
156
Download
156 pages
18.47 Kb
114
115
116
117
118
119
120
121
alarm clear
errors port_number
Working status indicator
Admin authority command
Config command
Reset command
Diagnostics
Access control list zones
Set Setup command
Command line interface CLI
Page 117
Image 117
Page 116
Page 118
Page 117
Image 117
Page 116
Page 118
Contents
Intel Blade Server Switch Module
SBCEFCSW Management and User’s Guide
Order Number C39671-003
Disclaimer
Contents
Page
Contents
4 Switch management utility functions
Safety and regulatory information
Electrical Safety
General Safety
Handling electrostatic discharge-sensitivedevices
Safety compliance
Regulatory specifications and disclaimers
Electromagnetic compatibility notice USA
Electromagnetic compatibility EMC
RRL Korea
Japan EMC Compatibility
English translation of the previous notice
xiii
Page
Related publications
1 Introduction
•QLogic Switch Interoperability Guide
QLogic SAN Solutions Guide
•QLogic SAN Configuration Guide: CLARiiON Storage
•QLogic SAN Configuration Guide: LSI Storage
Notices used in this book
Page
Logging on to a switch
2 Command line interface CLI
Command syntax
Commands
command
User authority commands
Table 1. Commands listed by authority level
Admin authority command
Admin session commands
admin
Admin command
cancel
Authority
alias
Alias command
add alias members
copy alias_source alias_destination
rename alias old alias new
remove alias members
config
Config command
activate config
backup
FCSM: user1> admin start
save config
FCSM admin : user1> config edit
FCSM admin-config :user1> config cancel
date
Date command
MMDDhhmmCCYY
Authority
fallback
Fallback command
Authority
Syntax
command
Help command
help
keyword
FCSM: user1> help set beacon set beacon On | Off
history
History command
Authority
Syntax
cleanup
Image command
image
unpack file
port number
Lip command for external ports only
Authority
Syntax
passwd
Passwd command
account_name
Authority
Authority
Ps command
Syntax
Examples
quit, exit, or logout
Quit command
Authority
Syntax
reset
Reset command
config config name
switch
Table 3. Port configuration defaults
Table 2. Switch configuration defaults
Default
External port 0,15 default
Table 4. Threshold configuration defaults
Table 3. Port configuration defaults continued
External port 0,15 default
Internal port 1-14default
Table 6. System configuration defaults
Table 5. SNMP configuration defaults
Default
Default
alarm clear
Set command
config option
setup option
Diagnostics
switch state
Online
Offline
set config
Set Config command
port port number
ports port number
Table 7. Set Config port parameters continued
switch
Table 8. Set Config switch parameters
Parameter
Table 8. Set Config switch parameters continued
threshold
Table 9. Set Config threshold parameters
zoning
On or to RAM volatile Off. The default is On
Table 10. Set Config zoning parameters
Default
Examples
FCSM user1 admin start
LoginMonitoringEnabled
set log
Set Log command
archive
clear
Other
Switch
Port
Zoning
enable alpa
Set Port command
set port port number
bypass alpa
Diagnostics
Down
Prepares the port for testing
Disables the port
set setup
Set Setup command
Table 11. SNMP configuration settings
Authority
Examples
Table 12. System configuration settings
Trap2Address
alarm
Show command
show
about
donor
domains
fabric
interface
Table 13. Show Port parameters
Entry
Description
steering domain_id
post log
support
setup option
users
topology
version
switch
FCSM: user1> show topology
Class2FramesIn
show config
Show Config command
switch
Authority
MFS TOV MSEnable True NoClose False
LOSMonitoringEnabledTrue RisingTrigger100
LogoutMonitoringEnabled True RisingTrigger5
FCSM: user1> show config zoning
Configuration Name: default
settings
Show Log command
show log
component
FCSM: user1> show log options
errors port_number
Show Perf command
show perf
byte
FCSM: user1>: show perf
Examples
show setup
Show Setup command
Authority
Syntax
FCSM: user1> show setup snmp
shutdown
Shutdown command
Authority
Syntax
test
Test command
port port_number test_type
Internal for internal and external ports
test x external
uptime
Uptime command
Authority
Syntax
user
User command
accounts
delete account_name
FCSM admin : user1> user list
FCSM admin user1 user del user3
admin@OB-session1- in admin mode
admin@OB-session2 user1@OB-session3
whoami
Whoami command
Authority
Syntax
zone
Zone command
add zone members
copy zone_source zone_destination
remove zone members
members zone
rename zone old zone new
type zone zone_type
wwn_0160ed zone_set_1 wwn_c001b0 zone_set_1
zoneset
Zoneset command
activate zone_set
active
rename zone_set_old zone_set_new
remove zone_set zone_list
zones zone_set
Notes
edit
Zoning command
limits
cancel
save
Examples
50:06:04:82:bf:d2:18:d2 21:00:00:e0:8b:02:41:2f
wwn wwn_b0241f 50:06:04:82:bf:d2:18:c2
wwn_23bd31 50:06:04:82:bf:d2:18:c2
50:06:04:82:bf:d2:18:d2 10:00:00:00:c9:23:bd:31
SAN Utility user interface
3 Using the SAN Utility
Figure 2. Faceplate window
Figure 1. Topology window
Menu bar
Figure 3. Menu bar selection examples
Table 14. Menu shortcut keys
Table 15. Toolbar buttons
Toolbar
Toolbar button
Toolbar button name
Graphic window
Fabric tree
Data window and tabs
Figure 4. Fabric tree
Using the Topology window
Working status indicator
Figure 5. Topology window
Working with switch modules and links
Fibre Channel switch module and link status
Switch module icon color
Status
Selecting switch modules and links
Arranging switch modules in the window
Using the Faceplate window
Topology data window tabs
Figure 7. Faceplate window
Port views and status
Opening the Faceplate window and pop-upmenus
Working with ports
Selecting ports
Managing fabrics
Setting up security
Faceplate data window tabs
Opening pop-upmenus
Adding a fabric
Managing the fabric database
Removing a fabric
5.Click Add fabric
Opening a fabric view file
Adding a new switch module to a fabric
Saving a fabric view file
Rediscovering a fabric
4.Click Switch / Restore
Replacing a failed switch module in a fabric
2.Click Switch / Delete
Displaying fabric information
Description
Switch module icon
Zoning a fabric
Active Zoneset Data window
Figure 9. Active Zonesets window
Access control list zones
Zoning concepts
Zones
Soft zoning
Aliases
Zoning configuration
Zone sets
Zoning database
Restoring default zoning
Using the Zoning Config window
Merging fabrics and zoning
Zone merge failure
Using the Edit Zoning window
Zone merge failure recovery
Figure 11. Edit Zoning window
Table 18. Edit Zoning window toolbar buttons
Managing zone sets
Creating a zone set
Activating and deactivating a zone set
Copying a zone to a zone set
Removing a zone set
Managing zones
Removing all zoning definitions
Creating a zone in a zone set
Renaming a zone or a zone set
Adding zone members
Removing a zone member
Removing a zone from a zone set
Removing a zone from all zone sets
Managing aliases
Changing zone types
Creating an alias
Managing switch modules
Adding a member to an alias
Removing an alias from all zones
Name Server data window
Displaying switch module information
•Click View ” Refresh
Figure 12. Faceplate data window
Table 20. Switch data window entries
Switch Data window
Table 19. Name server data window entries
Entry
Table 20. Switch data window entries continued
Link data window
Entry
Description
Fabric view port graphing application
Configured Zonesets Data window
Port Statistics Data window
Port Information Data window
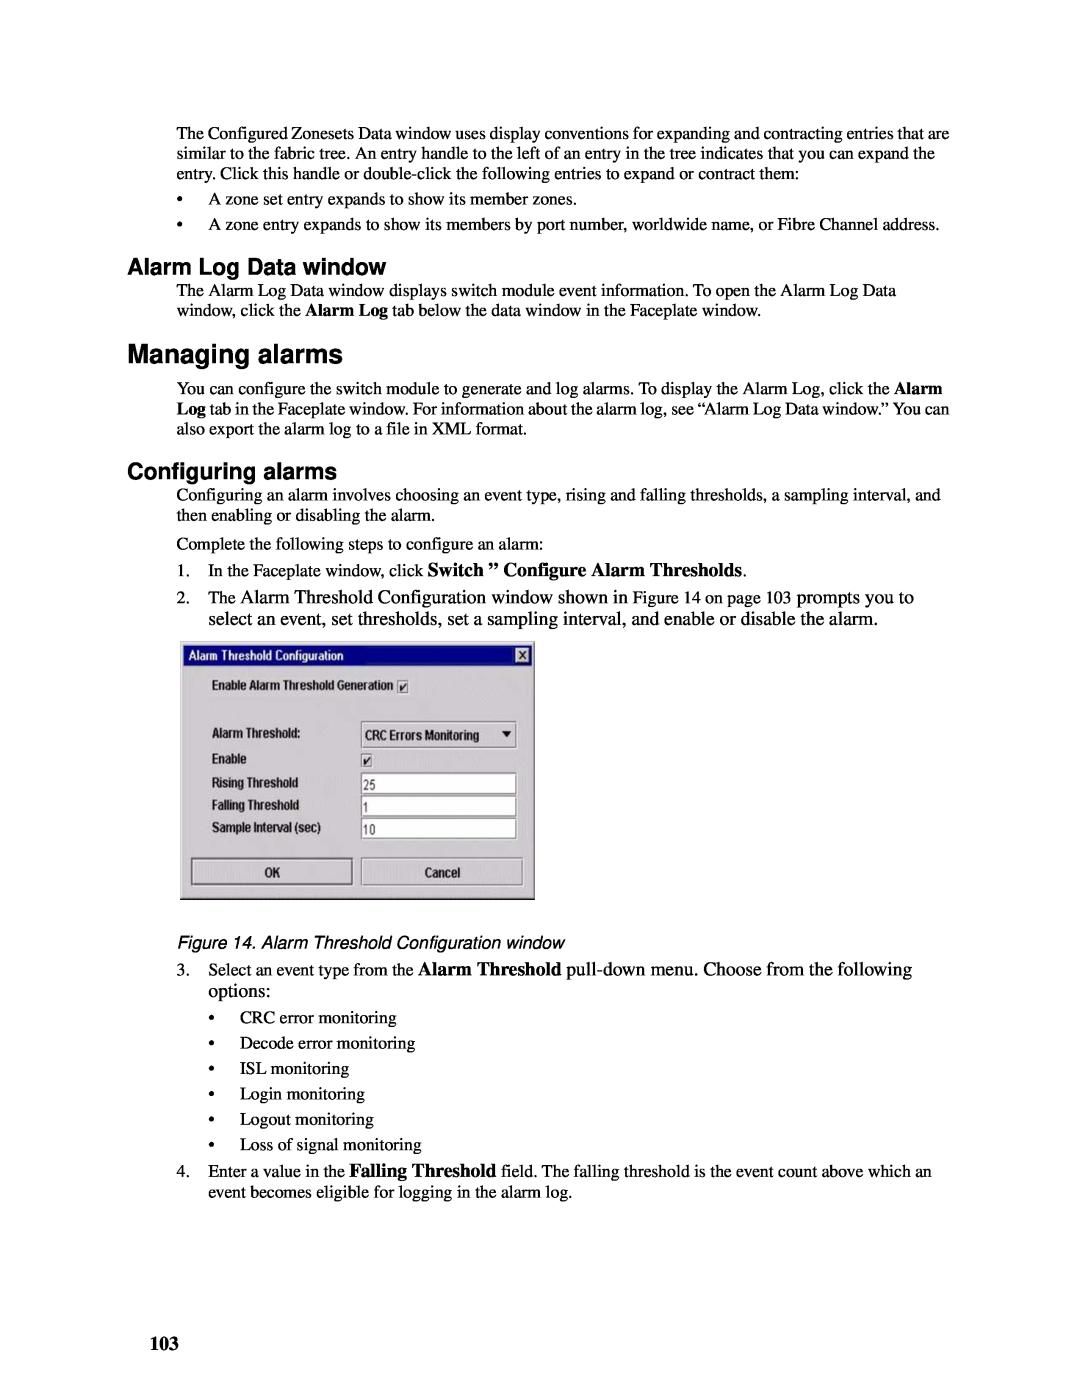
Managing alarms
Alarm Log Data window
Configuring alarms
Setting the date and time
Paging a switch module
Resetting a switch module
Exporting alarm log information to a file
Switch module properties
Configuring a switch module
Figure 15. Switch Properties window
Table 21. Switch module administrative states
Domain ID and Domain ID Lock
Broadcast support
In-bandmanagement
Network properties
Timeout values
Table 22. Timeout values
Figure 16. Network Properties window
IP configuration
Archiving a switch module
Remote logging
Table 23. IP configuration parameters
Managing firmware
Managing ports
Loading firmware
Activating the fallback firmware
Monitoring port status
Displaying port information
Figure 17. Faceplate Display Data window
Table 24. Port mode descriptions
Displaying port speeds
Displaying port operational states
Table 24. Port mode descriptions continued
Table 25. Port operational states
Port Statistics Data window
Port graphing and Fabric View application
Displaying SFP module media status
Table 27. SFP module media view
Entry
Description
Total LIP received
Table 29. Port Information Data window entries
Port Information data window
Configuring ports
Name Server Data window
Figure 18. External Port Properties window
Changing port administrative states
2.Click Port / Port Properties
Figure 19. Internal Port Properties window
Changing port modes external ports only
Changing port speeds external ports only
Table 30. Port administrative states
2.Click Port / Port Properties
Extending port credits
I/O stream guard
2.Click Port / Port Properties
Table 32. Port modes continued
Figure 20. Extended Credits window
2.Click Port ” Reset Port
Resetting a port
LED diagnostics
4 Switch management utility functions
Heartbeat LED patterns
Fatal error LED flash pattern
Normal all pass LED flash pattern
Internal firmware failure LED flash pattern
Switch module OK LED
Switch module fault LED flash pattern
Configuration file system error LED flash pattern
Port logged-inLED flash patterns
Port testing
Port fault LED flash patterns
Table 33. E-portisolation causes and fixes
Fibre Channel switch module monitoring using SNMP
SNMP configuration
Figure 22. Port Loopback Test window
Table 34. SNMP configuration parameters
SNMP trap configuration
Table 35. SNMP trap configuration parameters
Parameter
Configuration restore
Configuration backup
Restoring the factory default configuration
Table 36. Factory default configuration settings
Using the Fabric View application
Reinitializing the configuration file system
Restoring a switch module
Displaying port performance graphs
Starting the Fabric View application
Arranging and sizing port performance graphs
Figure 23. Fabric View graphs
Figure 24. Modify Graph Display window
Customizing port performance graphs
AMapping port locations and software numbering
Port mapping
Table 37. Port mapping
Page
Hardware/Software service and support
Using the documentation
B Getting help and technical assistance
Before you call
Page
Important notes
C Notices
Safety Compliance
Regulatory Specifications and Disclaimers
Declaration of the Manufacturer or Importer
Electromagnetic Compatibility EMC
Index
Page
Page
Page
Top
Page
Image
Contents