| Featured Functions |
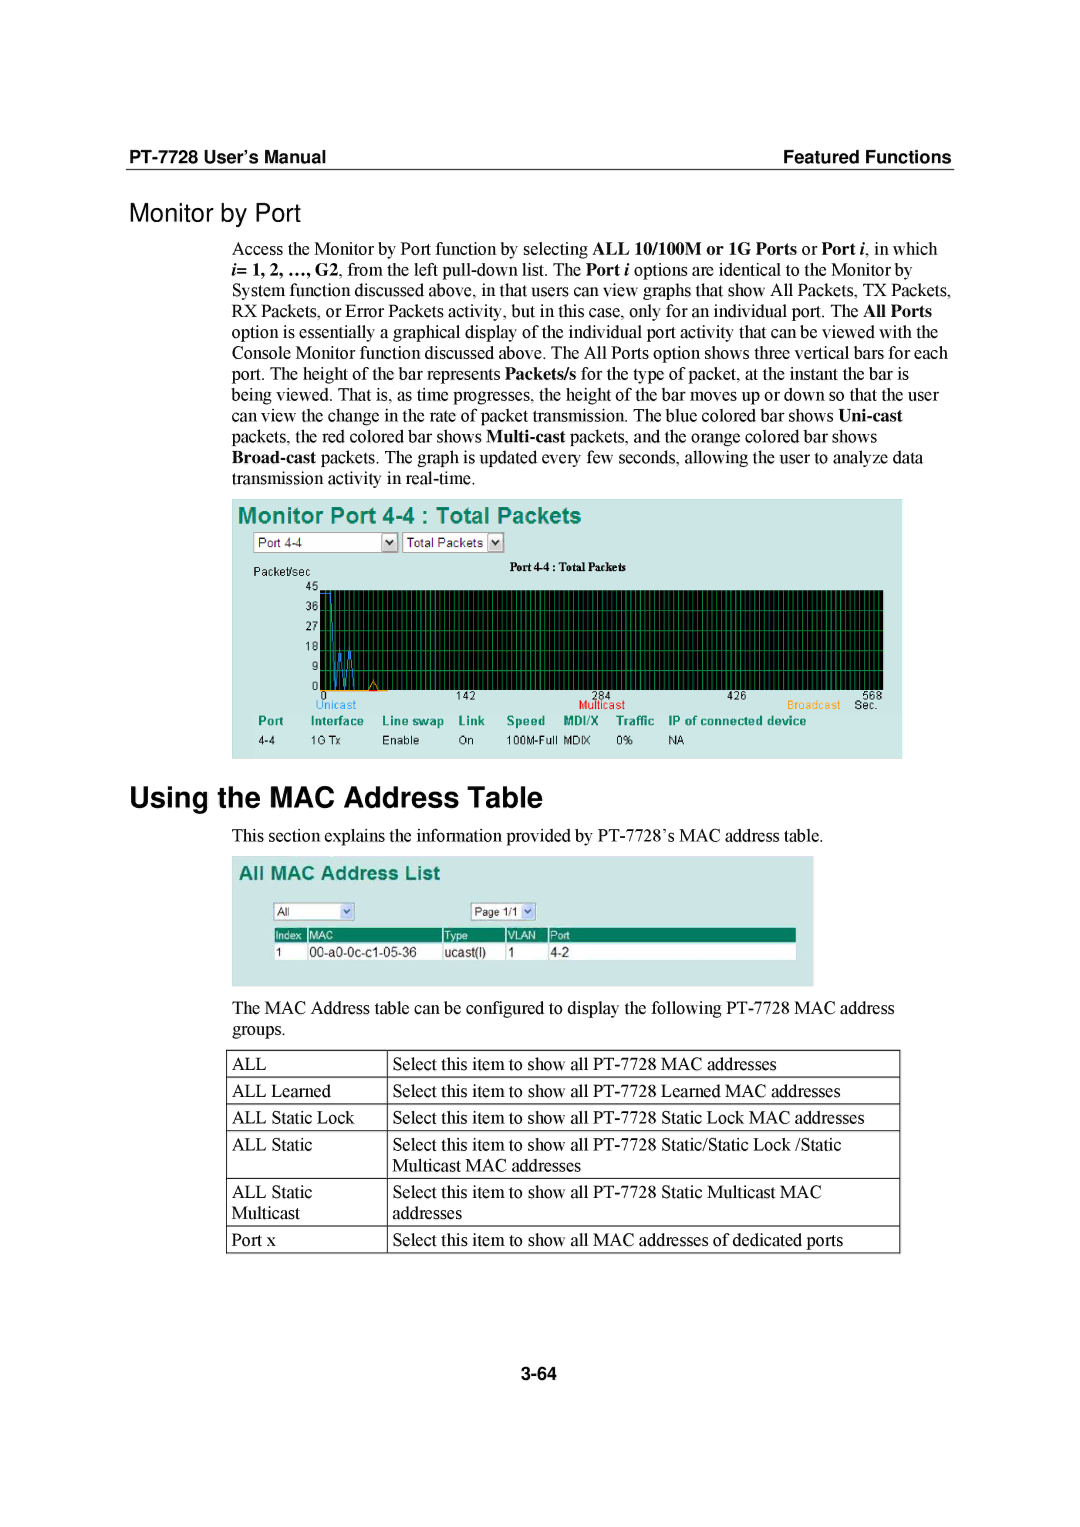
Monitor by Port
Access the Monitor by Port function by selecting ALL 10/100M or 1G Ports or Port i, in which i= 1, 2, …, G2, from the left
Using the MAC Address Table
This section explains the information provided by
The MAC Address table can be configured to display the following
ALL | Select this item to show all | |
ALL Learned | Select this item to show all | |
ALL Static Lock | Select this item to show all | |
ALL Static | Select this item to show all | Static/Static Lock /Static |
| Multicast MAC addresses |
|
ALL Static | Select this item to show all | Static Multicast MAC |
Multicast | addresses |
|
Port x | Select this item to show all MAC addresses of dedicated ports | |