4.3.5 Chart |
| ||||
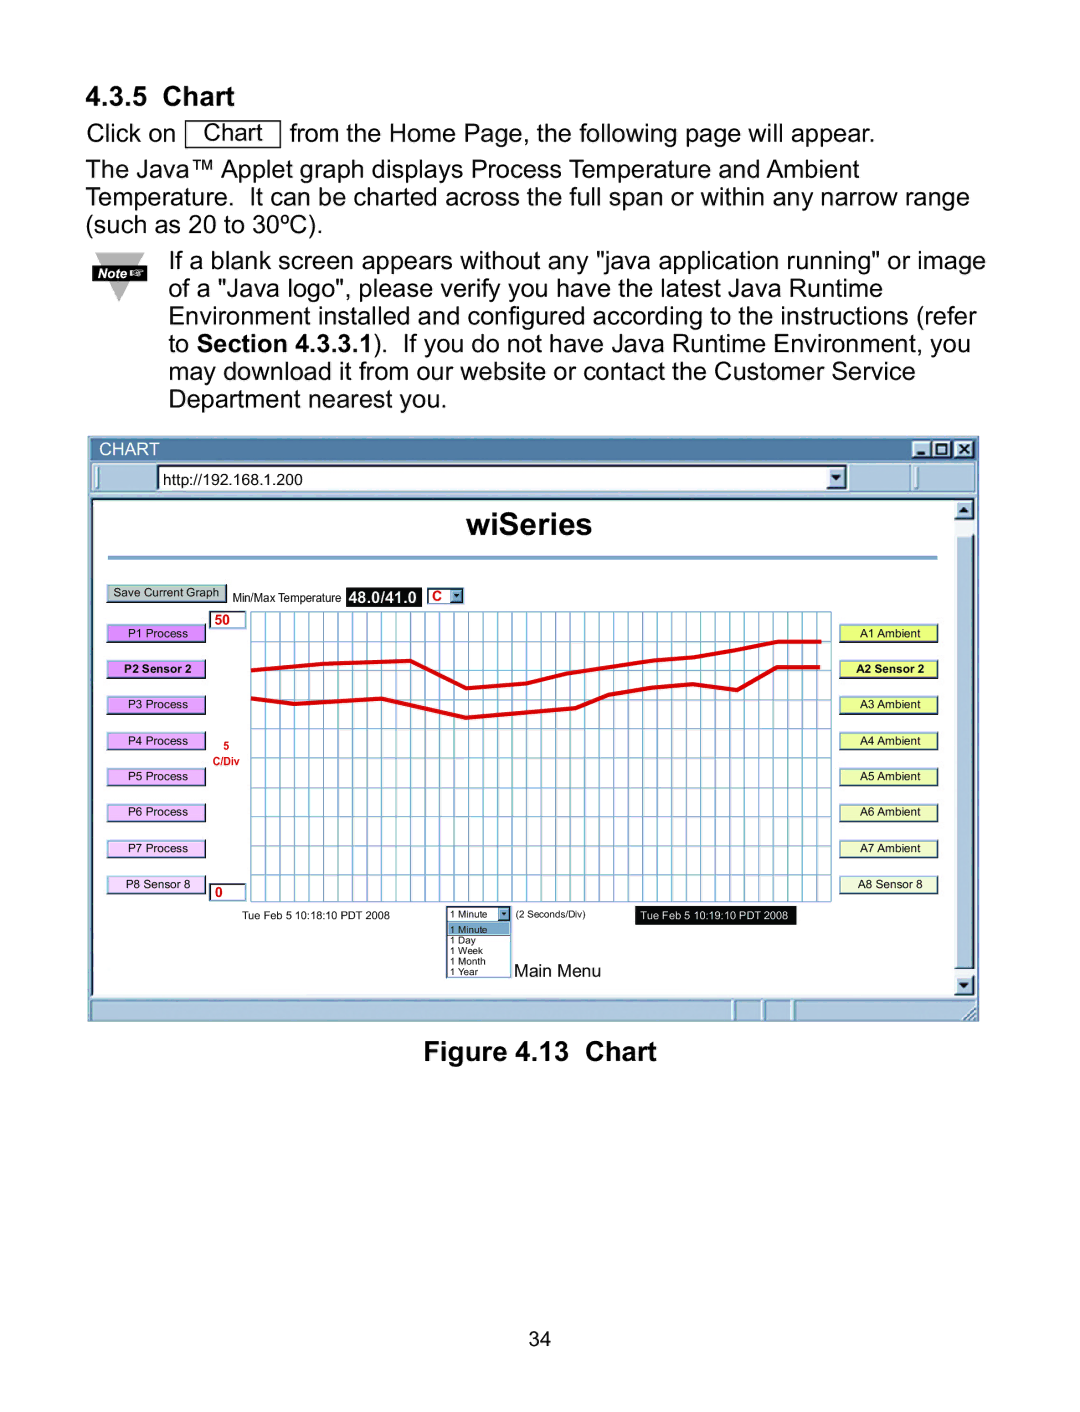
Click on | Chart |
| from the Home Page, the following page will appear. | ||
| |||||
The Java™ Applet |
| graph displays Process Temperature and Ambient | |||
Temperature. It can be charted across the full span or within any narrow range | |||||
(such as 20 to 30ºC). | |||||
|
| If a blank screen appears without any "java application running" or image | |||
|
| of a "Java logo", please verify you have the latest Java Runtime | |||
|
| ||||
|
| Environment installed and configured according to the instructions (refer | |||
|
| to Section 4.3.3.1). If you do not have Java Runtime Environment, you | |||
|
| may download it from our website or contact the Customer Service | |||
|
| Department nearest you. | |||
CHART http://192.168.1.200 |
| wiSeries |
|
| |||
|
|
|
|
|
| ||
Save Current Graph | Min/Max Temperature | 48.0/41.0 | C |
| 1200 | hPa | |
P1 Process | 50 |
|
|
|
| A1 Ambient | |
|
|
|
|
|
| ||
P2 Sensor 2 |
|
|
|
|
|
| A2 Sensor 2 |
P3 Process |
|
|
|
|
|
| A3 Ambient |
P4 Process | 5 |
|
|
|
|
| A4 Ambient |
P5 Process | C/Div |
|
|
|
| A5 Ambient | |
|
|
|
|
|
| ||
P6 Process |
|
|
|
|
|
| A6 Ambient |
P7 Process |
|
|
|
|
|
| A7 Ambient |
P8 Sensor 8 | 0 | Tue Feb 5 10:18:10 PDT 2008 | 1 Minute | (2 Seconds/Div) | Tue Feb 5 10:19:10 PDT 2008 | A8 Sensor 8 | |
|
|
| |||||
|
|
|
| 1 Minute |
|
|
|
|
|
|
| 1 Day |
|
|
|
|
|
|
| 1 Week | Main Menu |
|
|
|
|
|
| 1 Month |
|
| |
|
|
|
| 1 Year |
|
| |
Figure 4.13 Chart
34