4.3.6Diagnostic
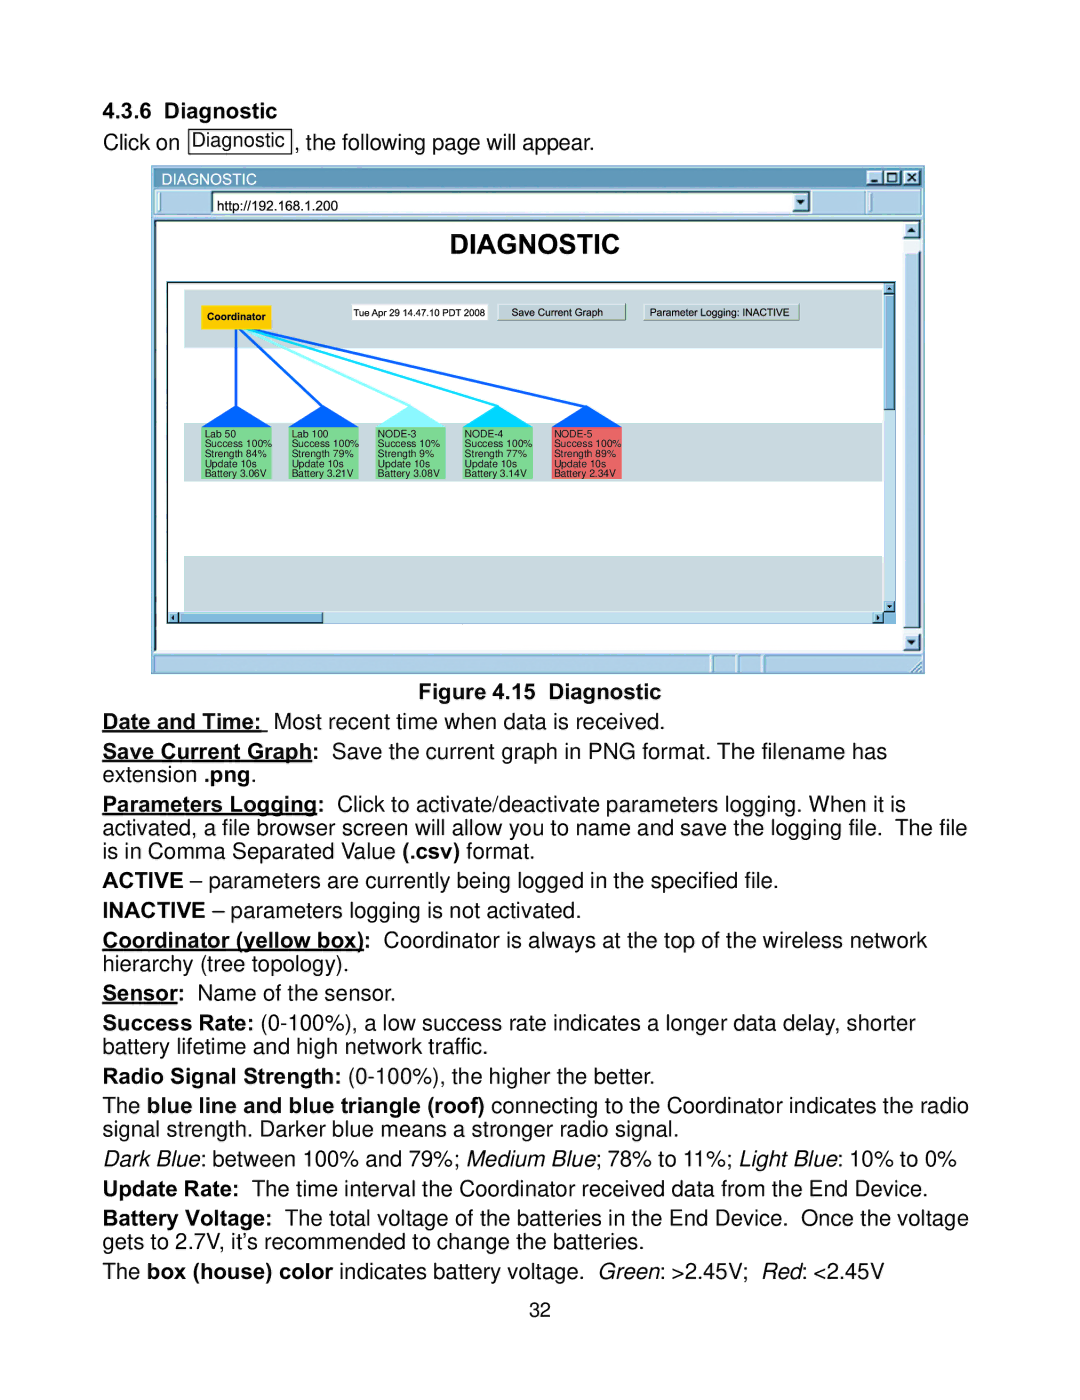
Click on Diagnostic
, the following page will appear.
Lab 50 | Lab 100 |
|
|
|
Success 100% | Success 100% | Success 10% | Success 100% | Success 100% |
Strength 84% | Strength 79% | Strength 9% | Strength 77% | Strength 89% |
Update 10s | Update 10s | Update 10s | Update 10s | Update 10s |
Battery 3.06V | Battery 3.21V | Battery 3.08V | Battery 3.14V | Battery 2.34V |
Figure 4.15 Diagnostic
Date and Time: Most recent time when data is received.
Save Current Graph: Save the current graph in PNG format. The filename has extension .png.
Parameters Logging: Click to activate/deactivate parameters logging. When it is activated, a file browser screen will allow you to name and save the logging file. The file is in Comma Separated Value (.csv) format.
ACTIVE – parameters are currently being logged in the specified file. INACTIVE – parameters logging is not activated.
Coordinator (yellow box): Coordinator is always at the top of the wireless network hierarchy (tree topology).
Sensor: Name of the sensor.
Success Rate:
Radio Signal Strength:
The blue line and blue triangle (roof) connecting to the Coordinator indicates the radio signal strength. Darker blue means a stronger radio signal.
Dark Blue: between 100% and 79%; Medium Blue; 78% to 11%; Light Blue: 10% to 0%
Update Rate: The time interval the Coordinator received data from the End Device.
Battery Voltage: The total voltage of the batteries in the End Device. Once the voltage gets to 2.7V, it’s recommended to change the batteries.
The box (house) color indicates battery voltage. Green: >2.45V; Red: <2.45V 32
