IntelliVue Patient Monitor
M8000-9001G
Table Of Contents
What’s New?
Patient Alarms and INOPs
ECG, Arrhythmia, and ST Monitoring
Capture 12-Lead
Monitoring Pulse Rate
Monitoring SpO2
Monitoring Invasive Pressure
Monitoring Carbon Dioxide
Monitoring tcGas
Monitoring BIS
Calculations
Recording
Using the Drug Calculator
Respiratory Loops
Accessories
Default Settings Appendix
TcGas Default Settings
Introducing the IntelliVue Family
Basic Operation
IntelliVue MP20/MP30
AC Power LED
MP20/MP30 Major Parts and Keys
MP20/MP30 left side MP20/MP30 front panel
IntelliVue MP40/MP50
MP40/MP50 Major Parts and Keys
MP40/MP50 left side
MP40/MP50 front panel
IntelliVue MP60/MP70
IntelliVue MP80/MP90
MP60/MP70 Major Parts and Keys
MP80/MP90 Major Parts and Keys
Remote Alarm Device
D80 Intelligent Display
Display Unit
Related Products
Docking Station
Flexible Module Server M8048A
Measurement Modules
Example Module Pressure
Multi-Measurement Server M3001A
Measurement Server Extensions
M3001A Connectors and Symbols
M3014A Capnography M3016A Mainstream
M3014A, M3015A and M3016A Capnography Extensions
M3012A Hemodynamic
M3012A Hemodynamic Measurement Server Extension
Enter Main Setup menu
Operating and Navigating
Monitor information line Other screen elements
Using the Touchscreen
Using the Setup Menu
Selecting Screen Elements
Disabling Touchscreen Operation
Follows the Silence permanent key configuration
Using the SpeedPoint
Using a Mouse or Trackball
Using the Navigation Point
Using Keys
Permanent Keys
SmartKeys
Pop-Up Keys
Hardkeys
Using the On-Screen Keyboard
Using the On-Screen Calculator
MC MR M+ Back √ C/CE
Standby Mode
Select Main Setup, followed by Monitor Standby
Operating Modes
Switching to a Different Screen
Changing a Screen’s Content
Understanding Screens
Using Additional Displays
Change Screen menu
Waves a Split Screen a Loops Cardiac Output Vital Signs a
Measurement Settings
Using the Visitor Screen
Monitor Settings
Understanding Profiles
Measurement a Measurement B Measurement C Measurement D
Swapping a Complete Profile
Swapping a Settings Block
Understanding Settings
Default Profile
Changing Measurement Settings
Switching Numerics On and Off
Switching a Measurement On and Off
Adjusting a Measurement Wave
Changing Wave Speeds
Changing Wave Speed for a Channel
Freezing Waves
Freezing An Individual Wave
Freezing All Waves
Using Labels
Conflicting measurement
Resolving Label Conflicts
Labels are shown in red
De-activated labels are Grayed-out
Adjusting the Screen Brightness
Changing Monitor Settings
Adjusting Touch Tone Volume
Setting the Date and Time
Setting up the Measurement Servers and Modules
Switching On
Checking Your Monitor Revision
Getting Started
Using Remote Applications
Disconnecting from Power
Monitoring After a Power Failure
Networked Monitoring
Remote Applications SmartKey
Remote Application Popup Keys
Pop-Up Keys Selecting this pop-up key lets you
Again
What’s New in Release D.0?
What’s New?
What’s New in Release C.0?
What’s New in Release B.1?
What’s New in Release B.0?
What’s New in Release A.2?
What’s New in Release A.2?
↑ ** HR High
Alarms
Visual Alarm Indicators
Audible Alarm Indicators
Alarm Tone Configuration
Minimum Volume for No Central Monitoring Inop
Changing the Alarm Tone Volume
Traditional Audible Alarms HP/Agilent/Philips/Carenet
ISO/IEC Standard 9703-2 Audible Alarms
Pausing or Switching Off Alarms
Acknowledging Alarms
Alarm Reminder ReAlarm
Select Main Setup -Alarm Settings
To Switch All Alarms Off
To Pause All Alarms
To Switch Individual Measurement Alarms On or Off
While Alarms are Paused or Off
Restarting Paused Alarms
Alarm Limits
Resetting Arrhythmia Alarm Timeouts
Extending the Alarm Pause Time
Viewing All Alarm Limits
Changing Alarm Limits
Alarms
On/Off
Documenting Alarm Limits
About Automatic Alarm Limits AutoLimits
Alarm limits
Measurement value
Alarm Messages Window
Reviewing Alarms
Review Alarms Window
Alarm Review Pause Al Limits Alarms Min 10 Min
Understanding Alarm Messages
Latching Alarms
Viewing the Alarm Latching Settings
Testing Alarms
Alarm Behavior at On/Off
Alarm Latching Behavior
Patient Alarms and INOPs
Patient Alarm Messages
Alarm Message From Condition Indication
CCO/CCI LOW
CCO/CCI High
CPP High
CPP LOW
HR LOW
HR High
Irregular HR
Missed Beat
Pacer not Capt
NON-SUSTAIN VT
Pacer NT
Pacing
RR High
RR LOW
ST Multi
Vent Bigeminy
Alarm
Vent FIB/TACH
Vent Rhythm
Inop Message, Indication Source What to do
Technical Alarm Messages INOPs
BIS Cable Incompat
BIS DSC Update
BIS Cable Usage
BIS DSC Disconn
BIS Lead OFF
BIS Isoelectrc EEG
BIS Overcurrent
BIS Sensor Disconn
Cannot Analyze ST
Cannot Analyze ECG
CCI no BSA
CCO BAD Press Sign
CCO Press Overrang
CCO Press Invalid
CCO Pulse Overrang
CCO Recalibrate
Lead OFF
CO2 CAL Mode
CO2 Auto Zero
CO2 CAL Running
CO2 Check CAL
CO2 Update FW
Equip Malf
CO2 Equip Malf
CO2 Zero Required
CO2 Zero Failed
CO2 Zero Running
CPP CHK Sources
Eegx Leads OFF
Eegx Lead OFF
EEG Line Noise
EEG Muscle Noise
LL Lead OFF
Leads OFF
MMS Unplugged
MMS Unsupported
PPV BAD Signal
Signal
NBP Interrupted
NBP Measure Failed
Transducer
Malf
Pulsatile
Overrange
Spiro Upgrade
Some ECG Alarms OFF
Spiro Alarms Suppr
Resp Erratic
SpO2 Label Poor Signal
SpO2 label EXTD. Update
SpO2 label Deactivated
SpO2 label Equip Malf
CAL Mode
Label Upgrade
Configuration
CAL Failed
SVR/SVRI CHK Units
SVR/SVRI CHK Sources
SVR/SVRI SET CVP Used
CAL Requird
Stabilizing
No Transduc
Setup
Cable
Conf
Admitting a Patient
Managing Patients
Quick Admitting a Patient
Patient Category and Paced Status
Admitting a Centrally-Monitored Patient
Discharging a Patient
Editing Patient Information
Transferring a Centrally-Monitored Patient
Transferring Patients
MMS Trend Upload and MMS Settings Upload
Data Upload from an MMS
Transferring a Patient with an MMS no Central Station
Data Exchange Between Information Centers
Resolving Patient Information Mismatch
Manually Resolving Patient Mismatch
Patient Mismatch If Neither Patient Data Set is Correct
Patient Mismatch If One Set of Patient Data is Correct
Automatically Resolving Patient Mismatch
Care Groups
Patient Mismatch If Both Patient Data Sets Are Correct
Patient Information This information is taken from
Depending on space available
Understanding the Care Group Overview Bar
Viewing the My Care Group Window
Main Setup menu, select My Care Group
Viewing the Other Bed Window
110
Care Group Alarms
Visual Alarm Status Information in the Other Bed Window
Other Bed Pop-Up Keys
Telemetry Data Overview
Unpairing a Telemetry Device
Suspending Telemetry Alarms
Silencing Telemetry Alarms from the Bedside
Using Standby
Telemetry Data Overview Screen Element
Skin Preparation for Electrode Placement
Connecting ECG Cables
ECG, Arrhythmia, and ST Monitoring
Checking Paced Status
Selecting the Primary and Secondary ECG Leads
Monitoring Paced Patients
Understanding the ECG Display
Changing the Size of the ECG Wave
Setting the Paced Status Pace Pulse Rejection
Avoiding Pace Pulse Repolarization Tails
To Change the Size of an Individual ECG Wave
Changing the Volume of the QRS Tone
Changing the ECG Filter Settings
To Change the Size of all the ECG Waves
About ECG Leads
Choosing Easi or Standard Lead Placement
ECG Leads Monitored
Changing Lead Sets
ECG Lead Placements
ECG Lead Fallback
Electrode labels Electrode colors
Standard 5-Lead Placement
Standard 3-Lead Placement
Chest Electrode Placement
Conventional 12-Lead ECG
Lead Placement
Choosing Standard or Modified Electrode Placement
Labelling 12-Lead ECG Reports
Modified 12-Lead ECG
Easi ECG Lead Placement
When Mod. LeadPlacement is set to Off
Capture 12-Lead
On the lower sternum at the level
ECG, Arrhythmia, and ST Alarm Overview
ECG Safety Information
Using ECG Alarms
106
Where Can I Find More Information?
About Arrhythmia Monitoring
Arrhythmia Options
Choosing an ECG Lead for Arrhythmia Monitoring
Switching Arrhythmia Analysis On and Off
Aberrantly-Conducted Beats
Atrial Fibrillation and Flutter
Intermittent Bundle Branch Block
Understanding the Arrhythmia Display
Viewing Arrhythmia Waves
Arrhythmia Beat Labels
Arrhythmia Status Messages
Rhythm Status Messages
Description Or E
Initiating Arrhythmia Relearning Manually
Arrhythmia Relearning
Ectopic Status Messages
Explanation Or E
Arrhythmia Alarms
Automatic Arrhythmia Relearn
Arrhythmia Relearn and Lead Fallback
Arrhythmia Alarms and Latching
Yellow Arrhythmia Alarms
Switching Individual Arrhythmia Alarms On and Off
Switching All Yellow Arrhythmia Alarms On or Off
What is a Timeout Period?
How are Yellow Arrhythmia Alarms Indicated?
Resetting the Timeout Period
Behavior of Unsilenced Arrhythmia Alarms
Red Arrhythmia Alarms
Arrhythmia Alarm Chaining
PVC Alarms Chain
Yellow Arrhythmia Alarms Beat Detection Alarms Chain
Non-Sustain Tach
Understanding PVC-Related Alarms
Run PVCs
Pair PVCs
Switching ST On and Off
About ST Monitoring
Selecting ST Leads for Analysis
ST-II ST-V ST-aVR
Understanding the ST Display
Recording ST Segments
Updating ST Baseline Snippets
About the ST Measurement Points
Adjusting ST Measurement Points
ISO Point ST Point J+60
ST-I
Single- or Multi-lead ST Alarming
ST Alarms
Changing ST Alarm Limits
Viewing ST Maps
ST Map Current
Trend View
Setup ST Analysis menu, select ST Map
Switching Between ST Map Views
Viewing an ST Map
Working in the ST Map Task Window
Updating an ST Map Reference Baseline
Displaying an ST Reference Baseline
Changing the Scale of the ST Map
Changing the Trending Interval
126
Entering the Setup Pulse Menu
Monitoring Pulse Rate
System Pulse Source
Using Pulse Alarms
Switching Pulse On and Off
Selecting the Active Alarm Source HR or Pulse?
Setup SpO2 menu
Alarm Source Selection Disabled
Changing HR/Pulse Alarm Limits
QRS Tone
130
Lead Placement for Monitoring Resp
Optimizing Lead Placement for Resp
Cardiac Overlay
Understanding the Resp Display
Auto Detection Mode
Changing Resp Detection Modes
Lateral Chest Expansion
Manual Detection Mode
Changing the Size of the Respiration Wave
Resp Detection Modes and Cardiac Overlay
Changing the Apnea Alarm Delay
Using Resp Alarms
Resp Safety Information
Changing the Speed of the Respiration Wave
135
136
Monitoring SpO2
SpO2 Sensors
Applying the Sensor
Measuring SpO2
Connecting SpO2 Cables
Assessing a Suspicious SpO2 Reading
Alarm Delays
Understanding SpO2 Alarms
Adjusting the Alarm Limits
Adjusting the Desat Limit Alarm
Setting SpO2/Pleth as Pulse Source
Perfusion Pleth Indicator
Setting Up Tone Modulation
Setting the QRS Volume
Choose the second measurement source
Introducing the Oscillometric NBP Measurement
Monitoring NBP
Measurement Limitations
Preparing to Measure NBP
Measurement Methods
Reference Method
Understanding the NBP Numerics
Correcting the Measurement if Limb is not at Heart Level
Starting and Stopping Measurements
Enabling Automatic Mode and Setting Repetition Time
Assisting Venous Puncture
Choosing the NBP Alarm Source
Calibrating NBP
Menu option Pressure value monitored
148
Monitoring Temperature
Selecting a Temperature for Monitoring
Making a Temp Measurement
Calculating Temp Difference
Extended Temperature Label Set
Monitoring Invasive Pressure
Setting up the Pressure Measurement
Selecting a Pressure for Monitoring
Zeroing the Pressure Transducer
Extended Pressure Label Set
Label Description
Zeroing ICP or IC1/IC2
Using the Zero Hardkey
Determining a Pressure’s Most Recent Zero
Zeroing a Pressure Measurement
Troubleshooting the Zero
Adjusting the Calibration Factor
Displaying a Mean Pressure Value Only
Changing the Pressure Wave Scale
Choosing the Pressure Alarm Source
Optimizing the Waveform
Non-Physiological Artifact Suppression
Making the Pressure Calibration
Calibrating Reusable Transducer CPJ840J6
Troubleshooting the Pressure Calibration
Calculating Cerebral Perfusion
Calculating Pulse Pressure Variation
Measuring Pulmonary Artery Wedge Pressure
Editing the Wedge
Identifying the Pressure Analog Output Connector
Monitoring Cardiac Output
Hemodynamic Parameters
Cardiac Output Transpulmonary
Using the C.O. Procedure Window
Measuring C. O. Using the PiCCO Method
Accessing the Setup C.O. and Setup CCO Menus
Entering the HemoCalc Window
Measuring Continuous Cardiac Output
CVP
Setting Up the PiCCO C.O. Measurement
Editing PiCCO C.O. Measurements
Performing PiCCO C.O. Measurements
Saving and Calibrating PiCCO C.O. Measurements
CCO Calibration Status Indicators
Measuring C.O. Using the Right Heart Thermodilution Method
Setting up RH C.O. Measurements
Ice-Bath Setup for RH Thermodilution C.O. Measurements
Documenting C.O. Measurements
Setting the Computation Constant
Performing RH C.O. Measurements
Editing and Saving RH C.O. Measurements
Cold Injectate Room Temperature Injectate Etvi Etvi ≥
Injectate Volume, Patient Weight and Etvi Values PiCCO Only
Injectate Guidelines
Guidelines for Right Heart Thermodilution C.O. Injectate
Possible Causes
CCO Curve Alert Messages
CCO Prompt Messages Possible Causes
CCO Prompt Messages
CCO Warning Messages
CCO Safety Information
CCO Warning Messages Possible Causes
O. module or measurement server extension has been plugged
174
Monitoring Carbon Dioxide
Preparing to Measure Mainstream CO2
Using the Capnography Extension M3014A
Preparing to Measure Sidestream CO2
Using the Sidestream Sensor Holder
Using the Mainstream CO2 Extension M3016A
Checking Transducer Accuracy
Removing Exhaust Gases from the System
Attaching and Removing the CO2 Transducer
Calibrating the Transducer
Using the Microstream CO2 Extension M3015A
Using Microstream Accessories
Preparing to Measure Microstream CO2
Removing Exhaust Gases from the System
Using the FilterLine and Airway Adapter
Adjusting the CO2 Wave Scale
Setting up Mainstream and Sidestream CO2
Setting up CO2 Corrections
Suppressing Zero Calibration
Changing the Apnea Alarm Delay
Changing CO2 Alarms
Deriving Alarms From awRR
Changing awRR Alarm Limits
185
186
Monitoring Airway Flow, Volume and Pressure
Attaching the Flow Sensor
189
Automatic Purging
Zero Calibration
Incorrect Balance Gas Setting N2O instead of N2
Adult Mode
Manual Purging
Gas Compensation
Optimizing Scale Settings
Setting up Spirometry
Alarms and Alarm Limits
Changing the Apnea Alarm Delay
Automatic Alarm Suppression
Setting the Gas Compensation Mode
Setup Spirometry menu, select Gas Compensation
Choosing Measured AWV Components
Changing the Temperature of the Inspired Gas
Identifying tcGas Module Components
Monitoring tcGas
Setting the tcGas Sensor Temperature
Using the tcGas Site Timer
Setting the tcGas Site Timer
Restarting the tcGas SiteTimer
Setting the tcGas Barometric Pressure
Disabling the tcGas Site Timer
Remembraning the tcGas Transducer
Storing tcGas Transducers
New/Dried Out Transducers
Calibrating the tcGas Transducer
Calibration Failure
Troubleshooting tcGas Calibration
Applying the tcGas Transducer
TcGas Corrections
Finishing tcGas Monitoring
Monitoring SvO2
Carrying out a Pre-insertion Calibration
Preparing to Monitor SvO2
Performing a Light Intensity Calibration
Inserting the Catheter
Performing In-Vivo Calibration
Setting Up the In-Vivo Calibration
Calculating Oxygen Extraction
Making the In-Vivo Calibration
Monitoring EEG
Percentage of total power in each frequency band
Using the EEG Impedance/Montage Window
EEG Monitoring Setup
EEG Montage SmartKey
KOhm ImpedanceLimit5kOhm EEG 1 F3-P3 EEG 2 F4-P4
Changing the Impedance Limit
Choosing an EEG Electrode Montage
Montage Name
Label1
About Electrode-to-Skin Impedance
Impedance Indicators
CSA contains the following information
About Compressed Spectral Arrays CSA
Changing CSA Settings
Changing EEG Settings
Switching EEG Numerics On and Off
Changing the Scale of the EEG Waves for Display
Changing Filter Frequencies
EEG Reports
Changing the Speed of the EEG Wave
CSA on Report
EEG and Electrical Interference
EEG Safety Information
Monitoring BIS
Monitoring BIS Using the DSC and BIS Engine
BIS Monitoring Setup
Board
Monitoring BIS using the BISx
Aspect BIS Sensor Aspect BISx 185-0145-PH
With sensors for single-patient use
BIS Cyclic Impedance Check
BIS Continuous Impedance Check
Manufacturer’s Information
Starting a Cyclic Impedance Check
BIS Impedance Indicators
Symbol Color Action
BIS Window
Switching BIS Filters On or Off
Switching BIS and Individual Numerics On and Off
Changing the BIS Smoothing Rate
Changing the Scale of the EEG Wave
BIS Safety Information
222
Viewing Trends
Trends
Viewing Vital Signs Trends
Viewing Graphic Trends
Trends Pop-Up Keys
Setting Up Trends
Making Segment Settings
Trend Interval
Trend Groups
Trend Priority
Trend Parameter Scales
Graphical Trend Presentation
Documenting Trends
Screen Trends
Trends Databases
Aperiodic Trends Database
Trending Multiple-Value Measurements
Setting the Screen Trend Time
Activating the Cursor for Screen Trends
Changing the Selection of Screen Trends Displayed
Changing the Screen Trend View
Tabular View
Setting the Horizon
Setting the Horizon Trend Scale
Horizon View
Calculations
Viewing Calculations
Hemodynamic Oxygenation Ventilation
Calculations Pop-Up Keys
Calculations Windows
Performing Calculations
Reviewing Calculations
Automatic Value Substitution
Entering Values for Calculations
Automatic Unit Conversion
Manual Unit Conversion
Documenting Calculations
238
Changing the Hi-Res Trend Waves Displayed
High Resolution Trend Waves
Hi-Res Trend Wave Scales
Hi-Res Trend Waves and OxyCRG
Printing Hi-Res Trend Wave Reports
Hi-Res Trend Wave Recordings
Recordings
Levels of Event Surveillance
Event Surveillance
Basic Event
Surveillance Advanced Event Surveillance
Event Episodes
Event Groups
Event Episode Types Pre-time Post-time
Events Pop-Up Keys
Open the Event Episode window to review the selected event
Detail
Event Triggers
SpO2 Resp
ABP
Setting Triggers for NER and Basic Event Surveillance
Event Retriggering
Event Notification
Set the event trigger
Triggering Events Manually
For each
HR Pulse
Events Database
Viewing Events
Event Counter
Counting Combi-Events
Counting Neonatal Event Review NER Events
AD21 BD71 AB D 11 D6 M0
Event Review Window
Event Summary Window
Apnea
Event Episode Window
Annotating Events
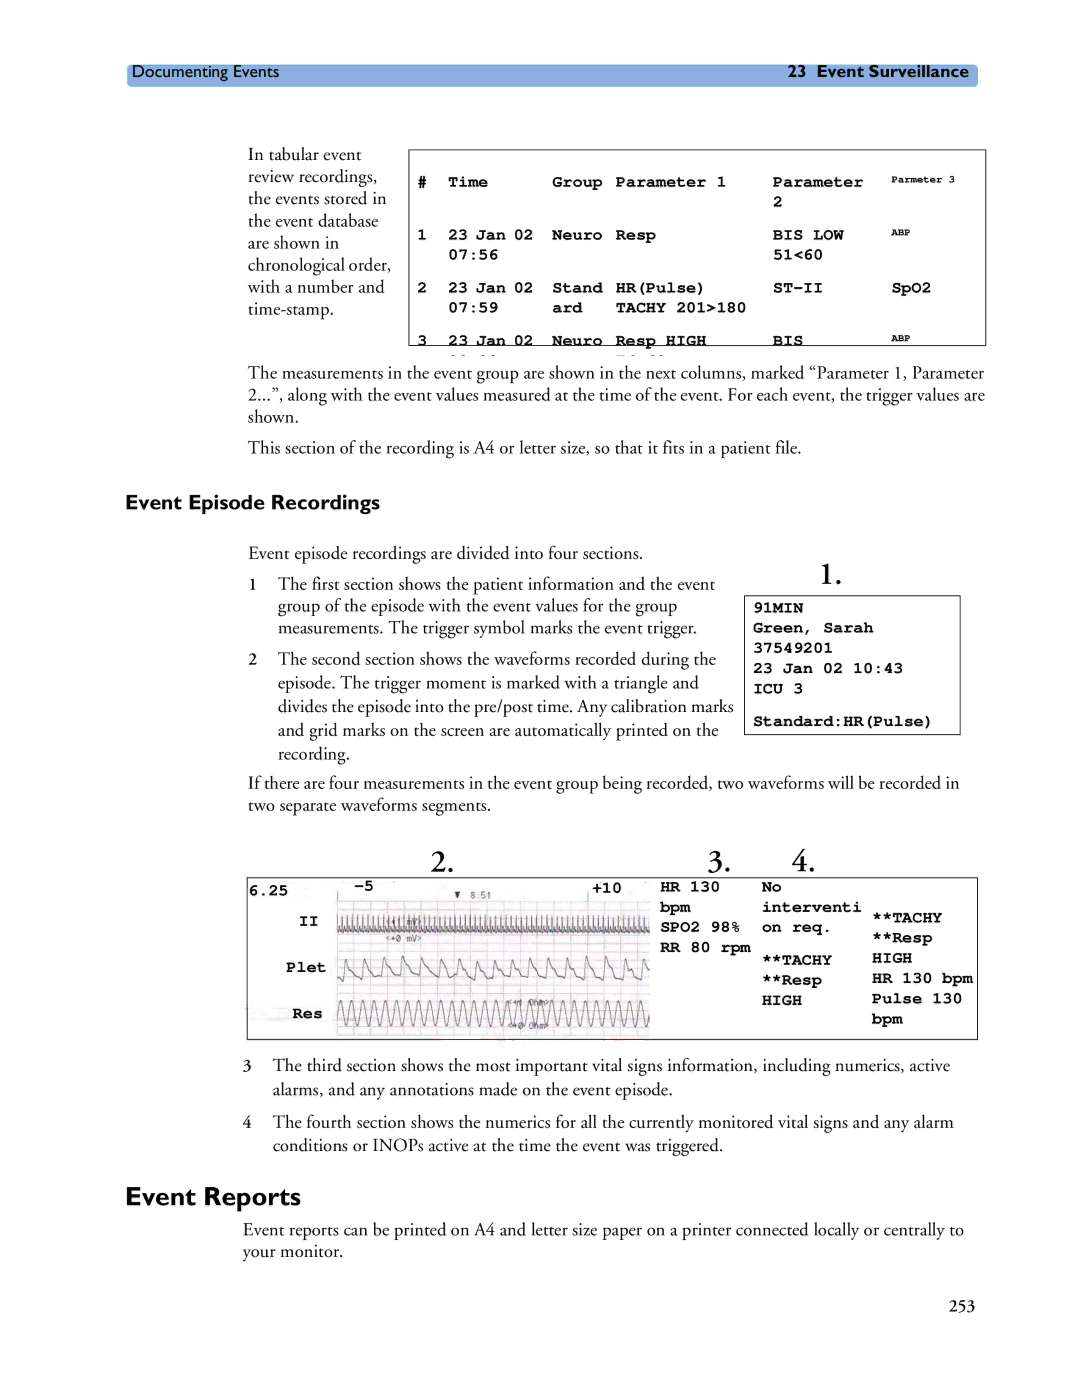
Documenting Events
Documenting Event Review
Documenting an Event Episode
Event Recordings
Event Review Recordings
Event Episode Recordings
Event Reports
Plet
Res
Event Review Reports
Event Summary Reports
Event Episode Reports
256
Stop key Stops the current recording
Recording
Quickstarting Recordings
Starting and Stopping Recordings
Extending Recordings
Overview of Recording Types
Stopping Recordings
Recording Without a Template
Creating and Changing Recordings Templates
All ECG Waves Recordings
Changing ECG Wave Gain
Setup Recording menu select General Select ECG Gain
Recording Priorities
Sample Recording Strip
Recording Strip Code
Recorded Waveforms
Maintaining Recording Strips
Code Meaning
Reloading Paper
Recorder Status Messages Explanation
Recorder Status Messages
266
Report types Report contents How to start printing reports
Printing Patient Reports
Starting Reports Printouts
Setting Up ECG Reports
Setting Up Reports
Stopping Reports Printouts
Limits
Setting Up Auto Reports
Setting Up Vital Signs and Graphic Trend Reports
Checking Printer Settings
Setting Up Individual Print Jobs
Unavailable Printer Re-routing Reports
Dashed Lines on Reports
Printer Status Messages
Sample Report Printouts
Printer Status Message Possible causes and suggested action
Patient Name
Alarm Limits Report
Realtime Report
Cardiac Output Report
ECG Reports
Other Reports
ECG Report type Available Formats Available Paper Sizes
Accessing the Drug Calculator
Using the Drug Calculator
Performing Drug Calculations
About the Rule of Six
Performing Calculations for a Non-Specific Drug
Drug Calculator
Performing Calculations for a Specific Drug
Using the Titration Table
Charting Infusion Progress
Documenting Drug Calculations
Titr.Table
Module Type Max External Devices Wave Numeric
VueLink Modules
Setup Device Name menu, select Show Device Data
Connecting an External Device
Changing VueLink Waves and Numerics Displayed
Viewing the VueLink Device Data Window
Using VueLink Screens
Switching VueLink On and Off
Alarms/INOPs From External Devices
Language Conflict with External Device Drivers
Viewing Timers
Using Timers
Select Main Setup Timers
Notification
Setting Up Timers
Timer Setup Pop-up Keys
Timer Types
Timer Label
Timer Counting Direction
Displaying Timers On The Main Screen
Select Change Numeric Select Any Timer
Run Time
Setup
Main Screen Timer Pop-up Keys
Displaying a Clock On The Main Screen
Label
Viewing Loops
Respiratory Loops
Select Main Setup
Capturing and Deleting Loops
Showing/Hiding Loops
Setting Up Source Device
Using the Loops Cursor
Setup VueLink Device menu
Changing Loops Display Size
Documenting Loops
General Points
Care and Cleaning
Cleaning
Cleaning Monitoring Accessories
Disinfecting
Cleaning the Recorder Printhead M1116B only
Cleaning the Batteries and Battery Compartment
Sterilizing
296
MP20/MP30 one or two Philips
Using the Batteries
Battery Power Indicators
Battery LED
Battery Status on the Main Screen
Battery status symbols
Battery Status Window
Checking Battery Charge
Viewing Individual Battery Status
Recording Battery Status
Replacing Batteries
Optimizing Battery Performance
Charging Batteries
Display Brightness Setting
Conditioning Batteries
Unequally-Charged Batteries
Battery Safety Information
304
Maintenance Troubleshooting
Inspecting the Equipment and Accessories
Inspecting the Cables and Cords
Maintenance Task and Test Schedule
Troubleshooting
Disposing of the Monitor
Disposing of Empty Calibration Gas Cylinders
308
ECG/Resp Accessories
Accessories
Trunk Cables
Electrode Cable Sets
Electrode One Piece Cables
NBP Accessories
Set Combiners and Organizers
Reusable Cuff Kits
Neonatal/Infant Cuffs Disposable, non-sterile
Adult/Pediatric Antimicrobial Coated Reusable cuffs
Patient Category
Bladder Tubing Width
Invasive Pressure Accessories
SpO2 Accessories
Transducer, accessories, sensor kits
Required
Philips disposable sensors. Available worldwide
Philips disposable sensors. Not available in the USA
MAX-A
Adapter Cable for Masimo sensors
Extension / Adapter Cables for Philips and Nellcor Sensors
Temperature Accessories
Cardiac Output C.O. Accessories
Right Heart Thermodilution
Transpulmonary Thermodilution
Mainstream CO2 Accessories for M3014A
Sidestream CO2 Accessories for M3014A
Mainstream CO2 Accessories for M3016A
Microstream CO2 Accessories
Spirometry Accessories
Microstream accessory selection flowchart
TcGas Accessories
EEG Accessories
BIS Accessories
SvO2 Accessories
Other BIS Accessories
BIS Sensors
Recorder Accessories
Installation and Specifications
Intended Use
Indication for Use
Manufacturer’s Information
BIS Manufacturer’s Information
Address of the EU Authorized Representative
Trademark Acknowledgement
Symbols
Symbols
Installation Safety Information
Connectors
12V
MP20/MP30
MP40/MP50
MP60/MP70
333
MP80/MP90
Bedside Adapter Wireless Network Adapter
Monitor Safety Specifications
Altitude Setting
Physical Specifications
Product
H x D Comments
338
Monitor MP40, MP50, MP60, MP70, MP80, MP90 Condition Range
Environmental Specifications
Monitor MP20, MP30 Condition Range
Monitor MP20, MP30, MP40, MP50, MP60, MP70, MP80, MP90
Docking Station M8045A Condition Range
D80 Intelligent Display Condition Range
Remote Alarm Device M8025A Condition Range
M4605A Battery Specifications
Thermal Array Recorder Module M1116B Condition Range
Remote SpeedPoint M8026A Condition Range
MP20/30, MP40/50, MP60/70/80/90
Monitor Performance Specifications
MP20/MP30
Indicators
Sounds
Trends
Review Alarms
Alarm signal
MMS M3001A Performance Specifications Trends
D80 Intelligent Display Performance Specifications
Monitor Interface Specifications
Display Specifications
Video Interface MP60
IntelliVue 802.11 Bedside Adapter Wireless Network Adapter
MP70/MP80/MP90
Sxga MP80, MP90
Measurement Specifications
ECG/Arrhythmia/ST Performance Specifications
ECG/Arrhythmia/ST
Time to Alarm for
ECG/Arrhythmia/ST Alarm Specifications Range Adjustment
Extreme Tachy
Extreme Brady
Respiration Performance Specifications
Respiration
SpO2
SpO2 Performance Specifications
NBP Performance Specifications
Stat Mode Cycle Time
Auto Mode Repetition Times
Venipuncture Mode Inflation Inflation Pressure Adult
Range Adjustment Systolic
Invasive Pressure and Pulse
Invasive Pressure Performance Specifications
Alarms
Range Adjustment Delay Pressure
Temp
Temp
Microstream CO2 Humidity Correction Factor
M3015A Microstream CO2 Performance Specifications
M3014A Sidestream CO2 Performance Specifications
M3014A Mainstream CO2 Performance Specifications
Operating Temperature
Response Time
Mainstream CO2 Humidity Correction Factor
M3016A Mainstream CO2 Performance Specifications
Spirometry Performance Specifications
Spirometry
Interfering Gas and Vapor Effects On CO2 Measurement Values
Inspired Volume
Volume numeric
Expired Volume
Whichever is greater
Cardiac Output / Continuous Cardiac Output
CCO Performance Specifications
TcGas
TcGas Performance Specifications
SvO2
SvO 2 Performance Specifications
EEG Performance Specifications
Electromagnetic Compatibility EMC Specifications
Safety and Performance Tests
Accessories Compliant with EMC Standards
Electromagnetic Emissions
Recommended Separation Distance
Electromagnetic Immunity
367
Restart time
Fast Transients/Bursts
Default Settings Appendix
ECG, Arrhythmia, and ST Default Settings
Alarm Default Settings
371
372
Pulse Default Settings
SpO2 Default Settings
Respiration Default Settings
SpO 2 Settings Factory Adult Factory Pedi Factory Neo
SpO 2 Alarm Default Settings Adult Pediatric Neonatal
Temperature Default Settings
NBP Default Settings
Invasive Pressure Default Settings
Invasive Pressure PAP Settings
Settings Factory Adult Factory Pedi Factory Neo
Cardiac Output Default Settings
CO2 Default Settings
Spirometry Default Settings
Spirometry Adult Pedi Neo Settings
SvO2 Default Settings
TcGas Default Settings
TcGas Settings Factory Adult
SvO2 Settings
BIS Default Settings
EEG Default Settings
EEG Settings Factory Adult Factory Pedi Factory Neo
Adult Pedi Neo
Device Alarms Ignored Color Green
VueLink Default Settings
382
EEG 322 Hospira Inc
Timeout periods 113 yellow
Cpap Resp
DSC BIS
Fast
Marker input connector
Preparing skin for ECG Pressure
PVR/PVRI
Re-triggering events Retrolental fibroplasia SpO2
Viewing 223 trends pop-up keys 225 trends priority list
Module options 281 module setup Visible waves and numerics
Xii