Basic Operations
Advanced Operations
Preface
Plug the devices into separate electrical outlets
Safety Precautions
Sample Warnings
Page
Page
Using the Manuals
Following two manuals are included with your Ricoh R10
Key Features
Camera shake correction function reduces blurring P.106
Flag function quickly displays specified images P.123
Skew correction mode helps straighten skewed images P.46
Contents
Advanced Operations
Various Shooting Functions
117
Shooting/Playing Back Movies
Other Playback Functions
121
147
Changing Camera Settings
Direct Printing
153
184
Downloading Images to Your Computer
Appendices
201
Basic Operations
USB Cable Mini B cable
Rechargeable Battery Handstrap Battery Charger Warranty
Packing List
AV Cable
Camera User Guide CD-ROM GP.184
CD-ROM cannot be used with
Optional Accessories
Names of Parts
Camera
Front View
If you are using
Camera for the first time, read this section
How to Use the Mode Dial
Mode Dial Symbols and Descriptions
Picture Display
Shtr BtnStart
Page
Dpof
Battery Level Indication
About the Battery
Turn the power on and get ready to shoot
SD Memory Card available in stores
Formatting
Write-protecting your images
Charging the Rechargeable Battery
Plug the power cable into an outlet
Loading the Rechargeable Battery and SD Memory Card
Removing the Rechargeable Battery
Insert the rechargeable Battery
Close the battery/card cover and slide it back into place
Removing the SD Memory Card
Turning the Power On/Off
To turn the power on Press the Power button
To turn the power off Press the Power button
Setting the Language
Turn the power on for the first time after purchase
Check the display and then press the ADJ./OK button
Setting the Date and Time
Format, choose the date and time format
Read this section
Holding the Camera
Now you are ready
Preventing Camera Shake
Shooting with Auto Shooting Mode
Focusing
Gently press the shutter release button all the way
Using the Zoom Function
Using the Digital Zoom
Shooting Close-Ups Macro Shooting
Press the ADJ./OK button toward N Macro
Are
Press the ADJ./OK button toward F flash
Using the Flash
Press the ADJ./OK button ! to select the flash mode
Flash Range
Page
Shooting with Easy Shooting Mode
Shooting with My Settings Mode
Turn the mode dial to MY1 or MY2
Scene Modes
Turn the mode dial to
Press the Menu button to change the scene mode
Press the ADJ./OK button !#$ to select the scene mode
Returning to Normal Shooting Mode
Turn the mode dial to Scene
Press the Menu button
Half-press the shutter release button
Using the Skew Correction Mode
Zoom level appears on the picture display
Using the Self-Timer
Press the shutter release button
Viewing Your Images
Press the 6 Playback button
Checking the image in shooting mode
Grid View Thumbnail Display
Turn the zoom lever toward Thumbnail Display
Enlarging Images
Still image is enlarged
Using the camera for the first time, read this section
Deleting a File
If you are
Press the D button
Deleting All Files
Deleting Multiple Files at One Time
Time, read this section
Are using the camera for the first time, read this section
Repeat to select all the files you want to delete
Specifying Individual Files to be Deleted If you
Files you want to delete
Press the button !#$ to
Repeat Steps 5 and 6 to specify all the ranges
Specifying a Range of Files to be Deleted
Changing the Display with DISP. Button
During Playback Mode
Normal Symbol Display
With Level Setting set to Sound
With Level Setting set to Display
With Level Setting set to Disp + Snd
About the Electronic Level
Level indicator display
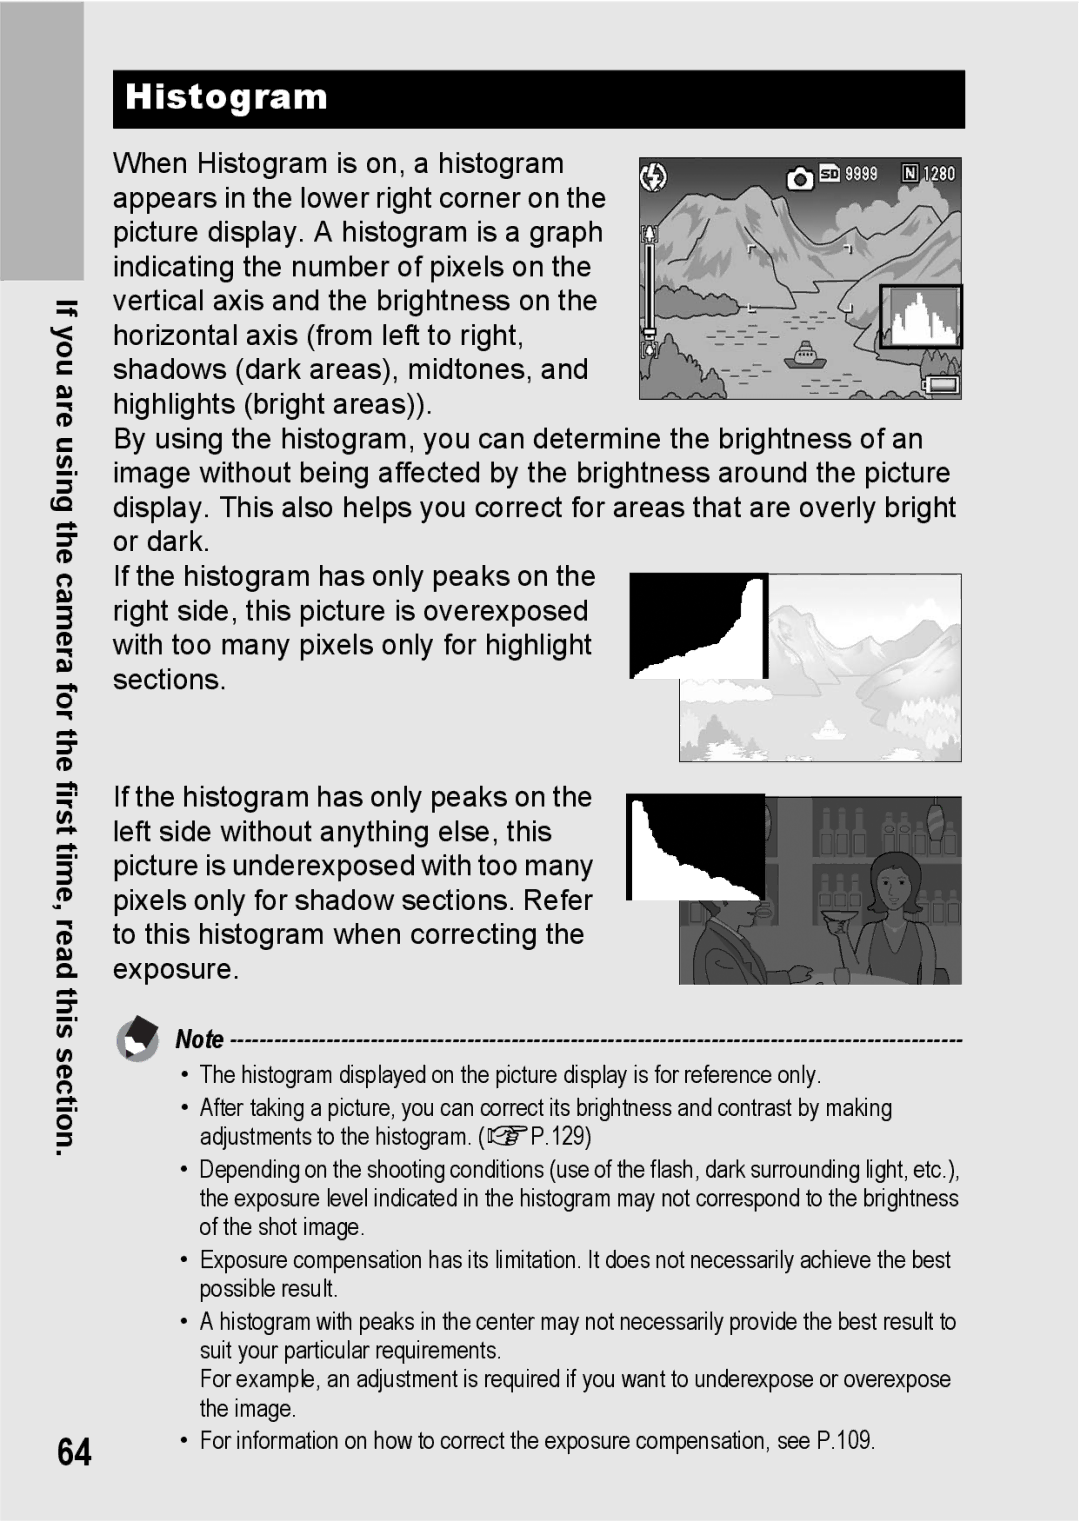
Histogram
Advanced Operations
Various Shooting Functions
Using the ADJ. Mode
Various Shooting Functions
Press the ADJ./OK button #$ to select the desired item
Various Shooting Functions
Changing the Text Density Scene Mode
Turn the mode dial to Scene Press the Menu button
Press the ADJ./OK button
Shifting the AE and AF Targets
Gently press the shutter release button all the way
Functions
Using the Fn Function Button
When Mode Dial is Set to
When Mode Dial is Set to Scene
When Mode Dial is Set to Easy
Shifting the AE and AF Targets MoveTarget
With the camera ready to shoot, press the Fn Function button
Shifting the AF Target and Shooting Close-Ups Macro Trgt
Locking the Exposure AE Lock
With the camera ready to shoot, press the Fn button
Switching Between On and Off for Various Functions
When Mode Dial is Set to 5/MY1/MY2
Shooting Menu
When Mode Dial is Set to Easy
Various Shooting Functions When Mode Dial is Set to Scene
Press the ADJ./OK button ! to select the setting
Using the Menu
Press the Menu button Shooting mode
Press the ADJ./OK button ! to select the desired menu item
Changing the display
Still Images
Movies
Display the shooting menu
Changing the Focusing Mode Focus
Focusing Modes
Manual Focus Shooting MF
Press the ADJ./OK button as required
Press the button # to display the focus bar
Press the shutter release button to shoot the picture
Changing the Exposure Metering Modes Exposure Metering
Exposure Metering Modes
Continuous
Stream-Cont
Memory-reversal-Cont
Continuous
Various Shooting Functions Display the shooting menu
Release your finger from the shutter release button
Press the 6 Playback button
Turn the zoom lever toward Enlarged View
Setting the Picture Quality and Color Image Settings
Picture Quality Modes
Customizing the Picture Quality Cust. Set
Various Shooting Functions Press the ADJ./OK button
Adjusting the Light Intensity of the Flash Flash Expo. Comp
Press the button ! to make the setting
Press the shutter release
Button to shoot the subject
Shooting Consecutively with Different White Balance WB-BKT
Press the shutter release Button to shoot the subject
Shooting Consecutively with Different Colors CL-BKT
Contrast, Sharpness and Color Depth During
Using Long Time Exposure Time Exposure
100
Shooting a Still Image with a Subfile Record Dual Size
101
102
Shooting with the Minimum Aperture Fix Min. Aperture
103
Shooting Pictures Automatically at Set Intervals Interval
104
105
To stop shooting, press the Menu button
106
Limiting the Shutter Speed Slow Shutter Lmt
107
Inserting the Date into a Still Image Date Imprint
108
Changing the Exposure Exposure Comp
When your subject is whitish
When your subject is darkish
109
110
Using Natural and Artificial Lighting White Balance
111
White Balance Modes
112
Setting the White Balance Manually Manual Settings
113
Various Shooting Press the ADJ./OK button
Changing the Sensitivity ISO Setting
114
115
116
Shooting Movies
117
Shooting/Playing Back Movies
Shooting/Playing Back Movies
Setting the Frame Rate Frame Rate
Turn the mode dial to Press the Menu button
118
119
120
Playing Back Movies
Other Playback Functions
Playback Menu
121
Other Playback Functions
122
Press the ADJ./OK button ! to select the desired item
Setting/Canceling One File at a Time
123
Setting/Canceling Multiple Files at One Time
124
125
Press the Fn button again as required
Changing the Image Size Resize
Trimming Still Images Trim
127
128
Correcting Images Automatically Auto
Correcting Images Manually Manual
Switch between points on Histogram
130
Press the Menu button to
131
Brightness by moving the middle point left Or right Example
132
Correcting the Image Color Tone White Balance Compensation
133
Straightening Skewed Images Skew Correction
134
135
Preventing the Deletion of Files Protect
Protecting a File
137
Protecting All Files
Press the 6 Playback button Press the Menu button
138
Protecting Multiple Files at Once
Displaying Photos in Order Automatically Slide Show
139
140
Using a Printing Service Dpof
Setting Dpof for the Displayed Still Image
141
Setting Dpof for All Still Images
142
Setting Dpof for Multiple Still Images
143
Restoring Deleted Files Recover File
144
Viewing on a Television
145
146
Direct Printing
Direct Print Function
147
Direct Printing
Connecting the Camera to a Printer
148
Printing One or All Still Images
Printing Still Images
149
Check that the printer is ready to print
Repeat Steps 7 and 8 to change other settings as required
150
Printing Several Still Images
Turn the zoom lever toward Thumbnail Display
152
Settings
Setup Menu
Changing Camera Settings
153
Using the Setup Menu
Changing Camera Settings
154
155
Changing the display
156
Press the Menu button or the ADJ./OK button
157
Display the setup menu
Press the button ! to adjust the brightness
158
Registering Custom Settings Reg. My Settings
159
Changing Camera Settings Settings Saved in Reg. My Settings
160
Setting the Zoom to a Fixed Focal Length Step Zoom
161
162
163
Changing the ISO Auto-High Setting ISO Auto-High
164
Changing the Size for Record Dual Size Sub File Size
165
Changing the Operation Sound Setting Operation Sounds
166
Changing the Operation Sound Volume Vol. Settings
167
Changing Image Confirmation Time LCD Confirm
168
169
Using the Auto Resize Zoom Digital Zoom Img
Available Settings
Zoom Magnification and Recorded Image Size
170
Assigning Functions to the ADJ./OK Button ADJ Btn. Set
171
Changing the Level Confirmation Setting Level Setting
172
Changing the AF Auxiliary Light Setting AF Aux. Light
173
Changing the Auto Power Off Setting Auto Power Off
174
Setting the LCD Auto Dimmer Mode LCD Auto Dim
175
176
Automatically Rotating the Playback Image Auto Rotate
177
178
Changing File Name Settings Sequential No
179
180
Setting the Date and Time Date Settings
181
Changing the Display Language Language/N
182
183
Downloading Images to Your Computer
For Windows
184
Downloading Images to Your Computer
System Requirements for Using the Supplied
185
CD-ROM Setup
When Installing the software is Clicked
186
187
Confirm the language, and then click OK
Click Installing the software
188
Click Next
Confirm the destination location and then click Next
Confirm where you want to install and then click Next
189
Click Finish
When Installing DeskTopBinder Lite is Clicked
Click Installing DeskTopBinder Lite
190
When Browse User’s Manual Software Version is Clicked
191
When Browse CD-ROM Content is Clicked
192
Acrobat Reader
Install Acrobat Reader by following the messages displayed
Uninstalling the Software
Click Browse CD-ROM Content
193
194
Restart your computer
Downloading Images Using the DL-10
195
DL-10 starts and image transfer begins automatically
Downloading Images Without Using DL-10
From the displayed drive Copy a file to the desired location
197
Downloading Images from an SD Memory Card
Disconnecting the Camera from Your Computer
198
For Macintosh
199
Downloading Images to Your Computer
200
201
Troubleshooting
Error Messages
Appendices
Camera Troubleshooting
Power Supply
202
203
Shooting
204
205
206
Appendices Playback/Deleting
Other Problems
207
208
Software and Computer Troubleshooting
When this warning message is displayed
If you clicked the Keep Blocking button
209
210 Specifications
211
NTSC, PAL
212
213
214
Using Your Camera Abroad
215
216
217
Precautions regarding care of your camera
Care and Storage
Care
Warranty and Servicing
218
219
Remarque Concernant les Utilisateurs au Canada
USA FCC Part15 Class B
Index
221
222
Telephone Support Numbers in Europe
If a problem arises
Ricoh International B.V. Epmmc