T9700Runner
FEEDBACK DISPLAY
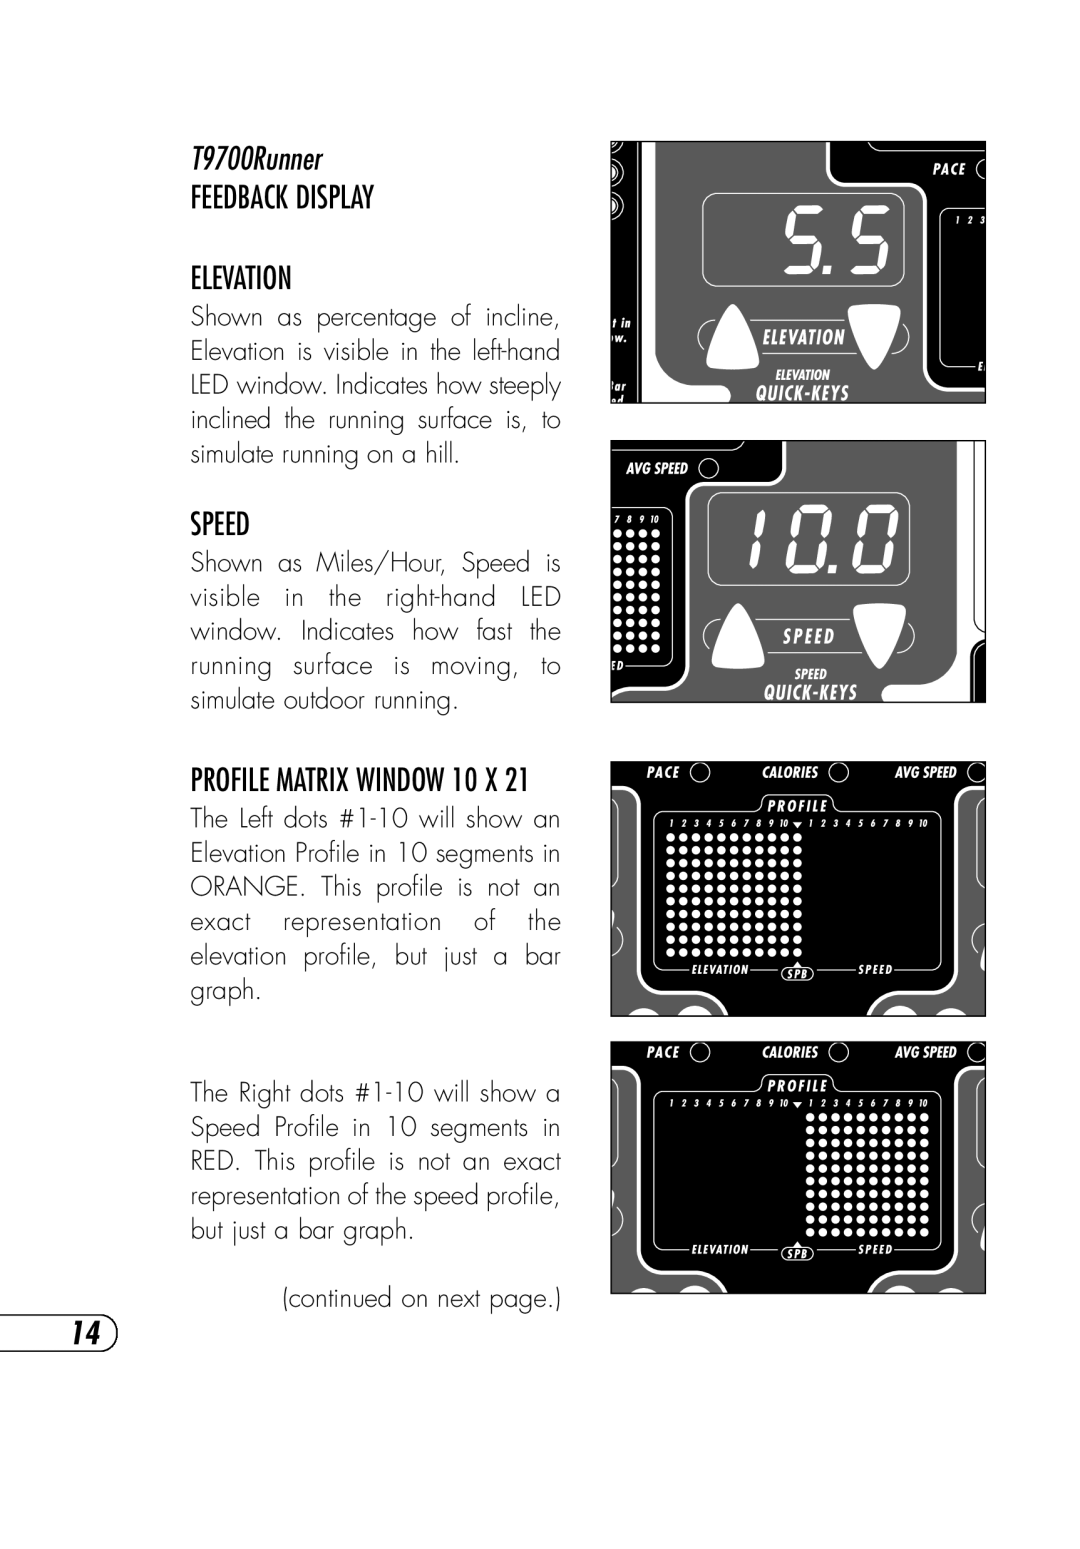
ELEVATION
Shown as percentage of incline, Elevation is visible in the
SPEED
Shown as Miles/Hour, Speed is visible in the
PROFILE MATRIX WINDOW 10 X 21
The Left dots
The Right dots
(continued on next page.)
14
Shown as percentage of incline, Elevation is visible in the
Shown as Miles/Hour, Speed is visible in the
The Left dots
The Right dots
(continued on next page.)
14