Sound Examiner
3MTM Sound Examiner SE-400 is Series Sound Level Meter
3MTM Sound Examiner SE-400 non-IS Models Sound Level Meter
RevA
Table of Contents
Iii Table of Contents
Figures
Introduction
Sound Examiner SE-400 Series overview
Models and options
Display and keypad
Diagram and functionality
Screen components identified
Keypad Description
Keypad keys identified
Connectors/Ports
3MTM Detection Management Software DMS
Getting Started
Checking the equipment
Turning on
Screen indicators
Softkeys
Measurement/Start screen
Turning off
Measurement screen views
Navigating
Charging
Charging states
Setup/instrument configuration
Response time and frequency weighting settings
Opening the setup screen for instrument configuration
Opening the Setup screen
Meter settings
Setting up meter parameters
Meter settings Explanations
Meter settings explained
SE-400 Series information details
Unit Information screen
Time and date setting
Setting the Time and Date parameters
Auto-Run and setting timed run
Setting the Timed Run
Security locking and unlocking run/setup
Lock/unlock secure setup
Secure run mode and secure setup mode locking & unlocking
Lock/unlock secure run
Resetting the SE-400 Series
Memory and space
Deleting files and viewing memory
Viewing memory and/or deleting files
Operation/Field Testing
Calibrate, measure, run, and saved results
Calibrate
Overview of running a session
SE-400 Series and calibrating
Calibration screen
Logged Data
Measure
Windscreen
Positioning and tripod mount
Measurements and displayed parameters
Measurement Explanations Parameters
Measurement notations
Main/multi- measurement screen in Run mode
Run, stop, and view results
Viewing past sessions
10 Session directory screen
Download and view logged data
12 Reviewing Session Data
DMS & downloaded measurements
14 Downloading files from DMS to SE-400 Series
SoundPatrol feature non-IS models only
Connecting the printer and settings
Print setup for summary reports
Changing the summary report print settings
Summary Data Report
Printing and reports
Calibration Report
Microphone preamp
Connecting an extension cable
Attaching the preamp
Sound Examiner non-IS models and logging rates
Logging Rates seconds or minutes Days
Acoustical Characteristics
Standards/Directives
Microphones
Appendix a
Mechanical Characteristics
Environmental Characteristics
Physical Characteristics
Measurements
Power/Electrical Characteristics
User Interface Characteristics
Ports and connections
Accessories sold separately
SE-400 Series models and part numbers
Appendix B
Glossary of Terms
Exchange Rate ER
Noise
Reference pressure
SPL/LAS
Weighting A, C, Z
Customer service
Warranty
Calibration
Contacting 3M Instrumentation
Data Addendum SE-400 Series measuring to IEC
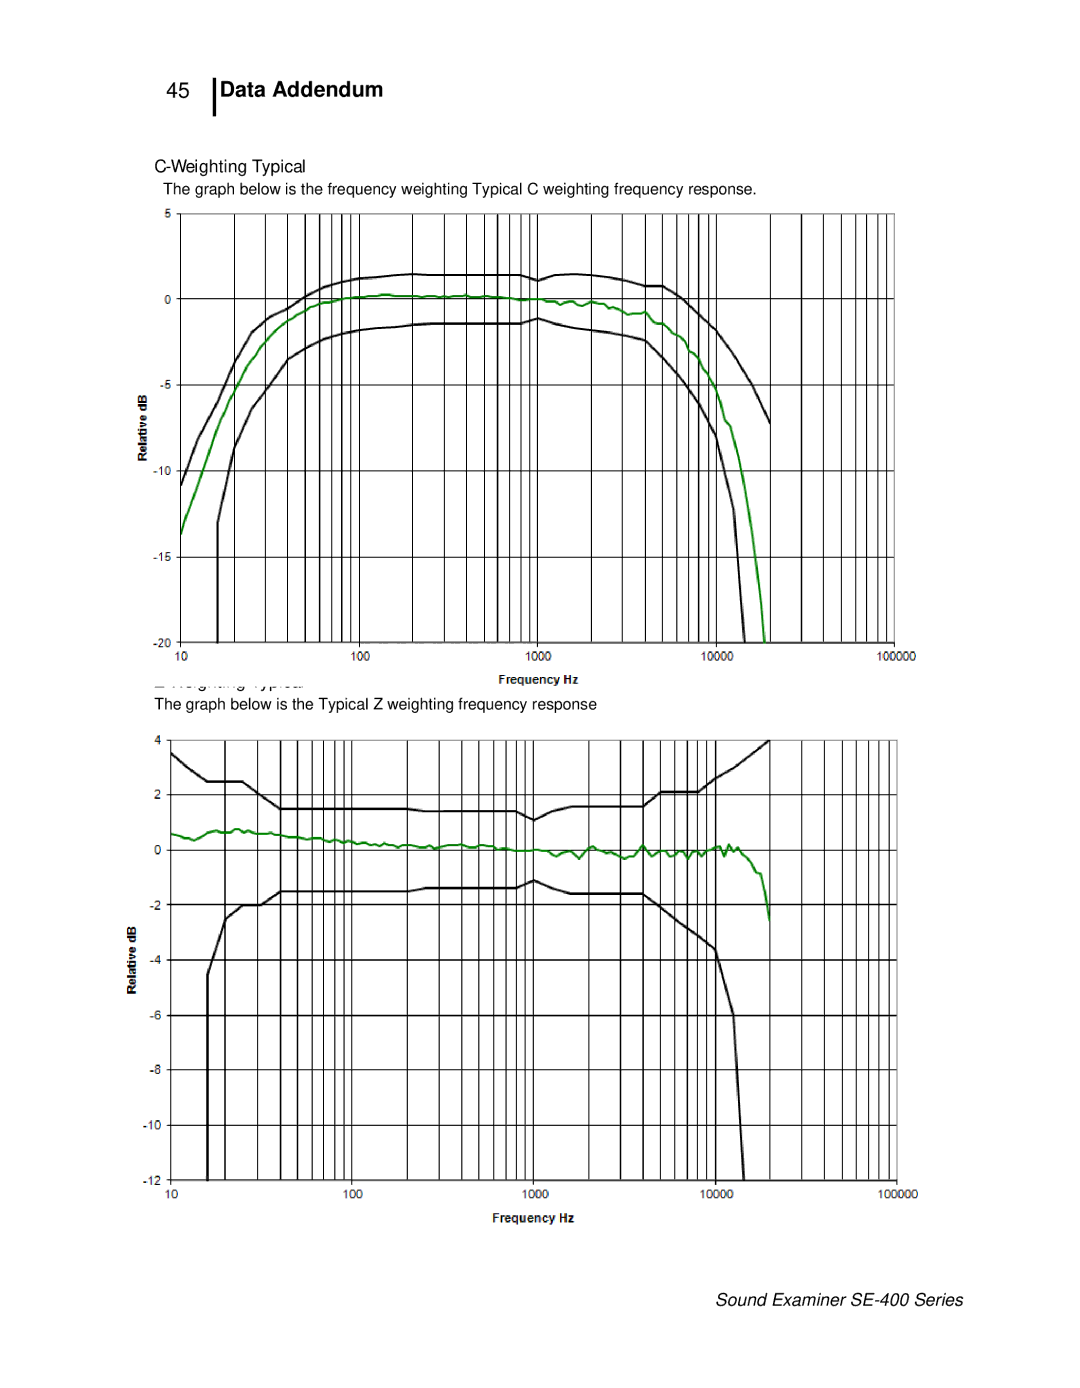
Data Addendum
Microphone Weighting
Correction in dB
Effects of background noise sections 5.6.4, 5.6.5, 9.2.5d
Frequency weighting sections 5.1.10 Weighting Nominal
Weighting Typical
Graph below is the Typical Z weighting frequency response
Nominal Frequency Hz
Nominal
Nominal Frequency Hz
Nominal corrections in dB
Data Addendum
3350
Nominal Frequency Hz Nominal corrections in dB
Data Addendum
Nominal
Data Addendum
BK4936 microphone
Free Field
Pressure Field to
Data Addendum
Data Addendum
Data Addendum
Data Addendum
Data Addendum
Data Addendum
QE7052 microphone
Data Addendum
Random Incidence
Windscreen
BK4936 microphone & RIC
Ricr & windscreen
BK4936 microphone, Ricr
Remote preamp
Windscreen
Remote preamp, & Ricr
Pressure to random incidence corrections with QE7052 section
Windscreen
Windscreen corrections with BK4936 microphone
Frequency
AC/DC Output Characteristics section
Resetting Overload, Under Range, Maximum, and Peak .2.5 k
Directional windscreen corrections section
Electrostatic discharges .5.2, 9.2.7 b
Data Addendum Environmental effects .1.2 and 9.3L
Microphones
Index
Index
QE7052 microphone side facing
Index
Index
Index
Index
Index
BK4936 microphone side facing
Index
BK4936 microphone back facing
Index
Index
Index
Index
Index
Index
Index
100
101
102
103
104
105
106
107
108
109
110
111
112
113
About 3M Personal Safety
About Us