19
Measure
Logged Data
Measure
Logged Data
Logged measurements compute the peak, maximum, minimum, sound exposure, and average values over a
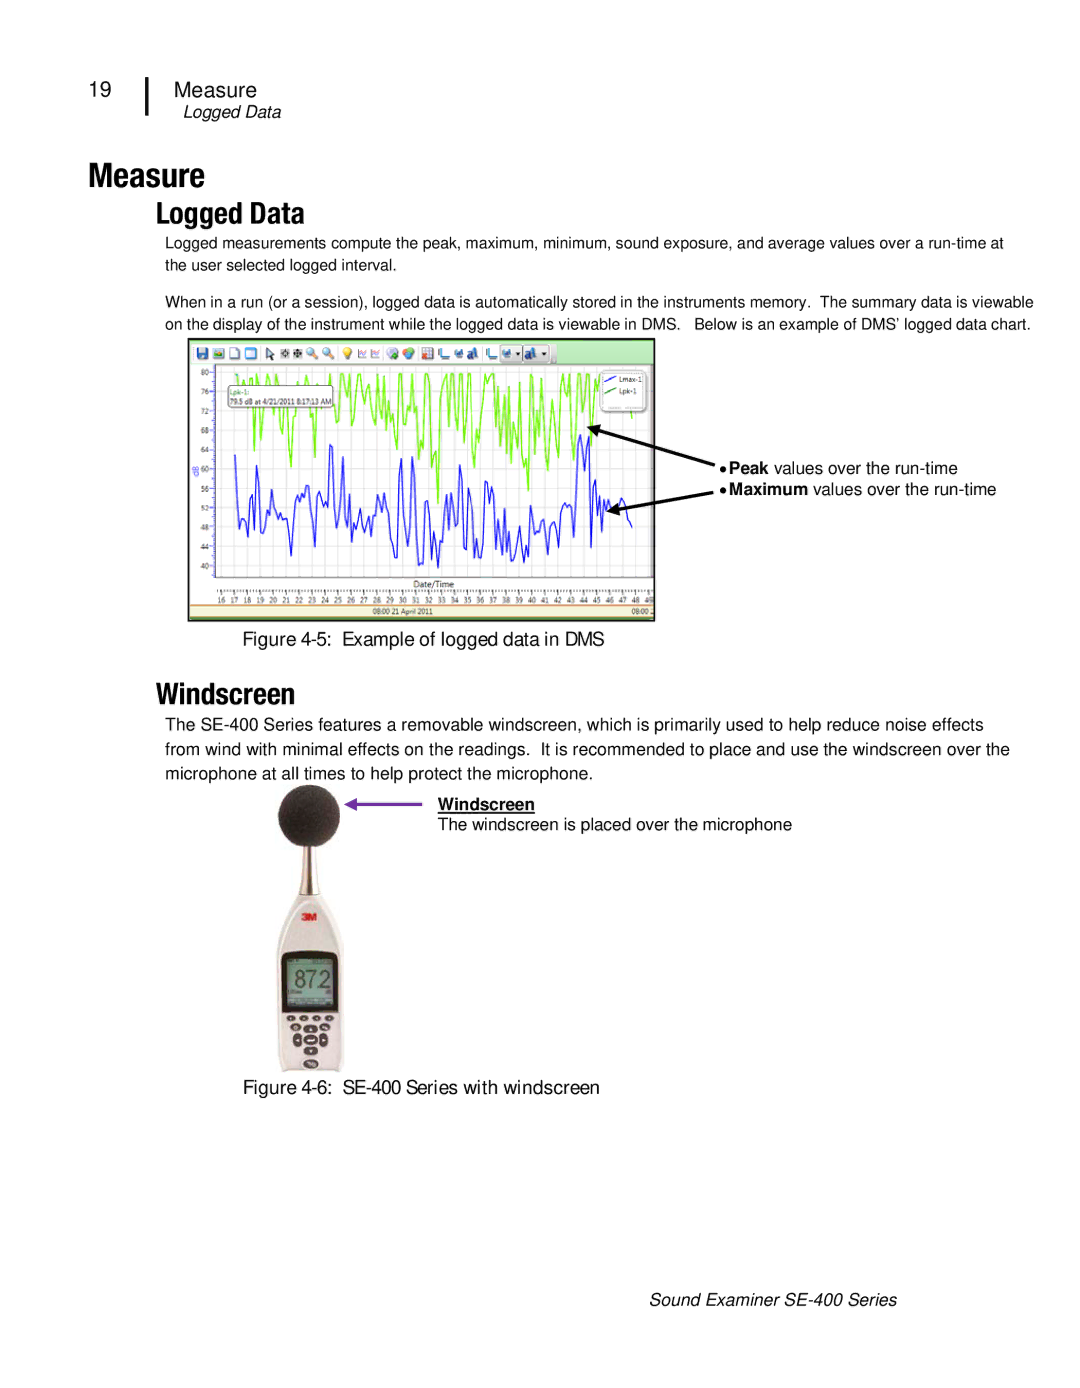
When in a run (or a session), logged data is automatically stored in the instruments memory. The summary data is viewable on the display of the instrument while the logged data is viewable in DMS. Below is an example of DMS’ logged data chart.
![]() • Peak values over the
• Peak values over the
• Maximum values over the
Figure 4-5: Example of logged data in DMS
Windscreen
The
Windscreen
The windscreen is placed over the microphone
Figure 4-6: SE-400 Series with windscreen
Sound Examiner