Agilent InfiniiVision Series Oscilloscopes
Newer version of this manual may be available at
Agilent Technologies, Inc
This User’s Guide…
Series Oscilloscope User’s Guide
Secure Environment Mode Option
100 MHz 300 MHz 500 MHz GHz
GSa/s
Oscilloscope History Action
Upgrade Options
Memory Depth Option Numbers
Maximum Memory Depth Mpts
Licensed Option Order
Order-Only Options
Using this book with the 6000L Series oscilloscopes
Built-in Quick Help
Digital Channels
Abbreviated instructions for pressing a series of keys
Contents
Maximum input voltage for analog inputs
Using the analog channels
To set up the screen saver
To perform service functions
To restore the oscilloscope to its default configuration
To switch all digital channels on or off
To switch groups of channels on or off
To switch a single channel on or off
Interpreting the digital waveform display
Setting Up the Oscilloscope and the VPT1000
Define the optional Reset on stage
Adjust the trigger level
Hex Bus Pattern Triggering
To use TV triggering
Source frequency/8
FFT Measurement
FFT Operation
Using the XGA video output
Varying the intensity to view signal detail
Selecting the Acquisition mode
Peak Detect Mode
To decode I 2 C data
To decode LIN data
To decode UART/RS232 data
UART/RS232 Totalizer
Waveform Trace and Oscilloscope Setup
Choosing save settings
To save a waveform and/or setup to a USB device
To recall waveform trace and/or oscilloscope setup
Index
Using Quick Help
Remote interface
To calibrate the probes
Getting Started
Getting Started
To inspect package contents
6000A Series Oscilloscope
Oscilloscope probes
MSO models only
6000A Series Option BAT Oscilloscope
Package contents for 6000L Series oscilloscopes
6000L Series Oscilloscope
Accessories available
Model Description
Active Probes Supported on
To adjust the 6000A Series handle
To mount the oscilloscope in a rack
To mount the 6000A Series oscilloscope in a rack
To mount the 6000L Series oscilloscope in a rack
Tools required not supplied
Step If needed
T E
Ventilation requirements
6000A Ventilation Requirements
6000L Ventilation Requirements
To power-on the oscilloscope
AC-Powered 6000 Series
Battery-Powered 6000A Series
Operating with the Internal Battery
Vrms, the oscilloscope must be grounded through its ground
Ground Post
Ground post on rear panel
Charging the Battery
Operating with the Automotive Power Adapter Cable
Replacing the Battery
Indicator will light
Power Cords
Plug Type Cable Part Number
Remote interface
Detailed Connectivity Information
To establish a LAN connection 6000A Series
To establish a LAN connection 6000L Series
Hostname
T E
To establish a point-to-point LAN connection
Stand-alone connection to a PC
To use the Web interface
Controlling the oscilloscope using a Web browser
Operating the oscilloscope using a Web browser
T E
Setting a password
Step
Select the Modify Configuration button
Main Menu Function Keys
Scrolling and Monitor Resolution
Identify Function
Identification Option
Printing the oscilloscope’s display from a web browser
LAN see the Agilent Technologies USB/LAN/GPIB Interfaces
Maximum input voltage in 50 Ω mode
To connect the oscilloscope probes
To verify basic oscilloscope operation
Press AutoScale
Series Oscilloscope User’s Guide
To compensate the oscilloscope probes
Perfectly compensated Over compensated Under compensated
To calibrate the probes
Passive Probes Supported
Passive Probes
Passive Probes Quantity Supported
Active Probes Supported
By 300 MHz, 500 MHz, and 1 GHz Bandwidth Models
Active Probes Quantity Supported
By 100 MHz Bandwidth Models
Active Probes for All 6000 Series Oscilloscopes
Using Quick Help
To view Quick Help on 6000L Series oscilloscopes
To view Quick Help on 6000A Series oscilloscopes
Quick Help Languages
Getting Started
Front-Panel Controls
6000L Series Oscilloscope Controls
Front Panel
Rear Panel
Front and Rear Panel Controls and Connectors
Channel Input BNC Connector
Probe Compensation Terminals
InfiniiVision 6000 Series Oscilloscope Programmer’s Quick
6000A Series Oscilloscope Front-Panel Controls
Graphic Symbols in Softkey Menus
Press Utility & I/O & Show I/O Config
Conventions
Channel 6000A Series Oscilloscope Front Panel
Front Panel Controls
Printing Data, starting on
Front-Panel Controls
Series Oscilloscope User’s Guide
Horizontal Sweep Speed Control
Series Oscilloscope User’s Guide
Trigger
Input
Interpreting the display
Softkeys
To adjust the waveform intensity
To adjust the display grid graticule intensity
6000A Series Front-Panel Operation
To start and stop an acquisition
To make a single acquisition
Memory Depth/Record Length Run/Stop versus Single
Single
Running
To pan and zoom
Auto Single
Choosing Auto trigger mode or Normal trigger mode
Using AutoScale
To set the probe attenuation factor
Passive Probes
Example
Manually Setting the Probe Attenuation Factor
Active Probes
Using the analog channels
Channel Trigger
Volts/div Source
Bandwidth Channel Invert
Turning channels off
MHz bandwidth oscilloscope is fixed at 1 MΩ . Therefore,
Impedance selection is not available on these models
Oscilloscope to the correct impedance
Measurement Hints
Front-Panel Controls
Save/Recall&Default Setup
Units Factor Probe
To set up the Horizontal time base
Main mode
Series Oscilloscope User’s Guide
Front-Panel Controls
Zoom mode
Press Menu/Zoom
These markers define Time/div for Delay time
Beginning and end Zoom sweep Main sweep
Zoom sweep window
Select main or Zoom sweep
Roll mode
XY mode
Axis Input in XY Display Mode Blanking
To make cursor measurements
To make automatic measurements
Using Labels
To turn the label display on or off
To assign a predefined label to a channel
Label Assignment Auto-Increment Features
To define a new label
To load a list of labels from a text file you create
Press Utility→ File Explorer
Label List Management
To reset the label library to the factory default
Defaulting labels without erasing the default library
To print the display
Press Utility &Options &Preferences
To set the clock
Press Utility&Options&Clock
Set
Set Day set Hour set
To set up the screen saver
Screen Saver is disabled on 6000L models
To set the waveform expansion reference point
To perform service functions
User Calibration
About User Cal Return to Self Test Oscilloscope Status
To perform User Cal
Longer cable To Trig OUT To Channel
User Cal Status
User Calibration cable for 4-channel oscilloscope
Self Test
About Oscilloscope
Installed licenses
To restore the oscilloscope to its default configuration
Viewing and Measuring Digital Signals
Supplied with the mixed-signal oscilloscope
To connect the digital probes to the circuit under test
Channel Pod Ground Circuit
Grabber
Signal Lead Ground Lead Grabber
Acquiring waveforms using the digital channels
Signals Ground
To display digital channels using AutoScale
Example
Series Oscilloscope User’s Guide 117
Activity indicator
Interpreting the digital waveform display
To switch all digital channels on or off
To switch groups of channels on or off
To switch a single channel on or off
To change the displayed size of the digital channels
To reposition a digital channel
To change the logic threshold for digital channels
Threshold you To change the logic threshold for digital
Logic family Threshold Voltage
To display digital channels as a bus
Bus softkey
Bus1/Bus2 Select Return to Softkey Individual Channel Base
Channels Group
Using cursors to read bus values
Binary
Binary or Hex
Bus values are displayed when using Pattern trigger
126
Triggering the Oscilloscope
Triggering Features
SPI USB
See Using Serial Decode on page 271 for more information
To select the Mode and Coupling menu
Selecting Trigger Modes and Conditions
Auto mode
Trigger modes Normal and Auto
Normal mode
To select trigger Coupling
To select trigger Noise Rejection and HF rejection
To set Holdoff
Holdoff
200 ns 600 ns
Holdoff Operating Hints
External Trigger Probe Settings
External Trigger input
Channel oscilloscope External Trigger input
Functions when the oscilloscope is powered on
To the oscilloscope may occur
Trigger Types
MegaZoom Technology Simplifies Triggering
To use Edge triggering
Edge Trigger
Slope
Trigger level adjustment
To use Pulse Width triggering
Polarity Trigger
Qualifier
Polarity
10 ns
Qualifier time set softkey
10 ns Trigger
10 ns 15 ns
To use Pattern triggering
Pattern Selected
Trigger Channel
Rising or
Specifying an Edge in a Pattern
Hex Bus Pattern Triggering
Bus1 or Bus2
For can decode setup see
To use can triggering
Signal source
Can trigger
Bits Condition Selector
Rate
Point
One Bit
Normal
To use Duration triggering
Duration Selected
Level Qualifier Qualifier time set Return to Select
Series Oscilloscope User’s Guide 153
When the duration trigger occurs
To use FlexRay triggering
Modes of VPT1000 Control/Operation
Setting Up the Oscilloscope and the VPT1000
Connecting the Oscilloscope and the VPT1000
Accessing the VPT1000 Menu
PC Controls the VPT1000
Sync Mode LAN Address
Specifying the VPT1000 LAN Address
Struct
Selecting the VPT1000 Control/Operating Mode
Restore synchronization
Asynchronous or Synchronous Mode In addition to the logic
Mb/s, or 10 Mb/s
Triggering on FlexRay Frames, Times, or Errors
Accessing the FlexRay Trigger Menu
Triggering on FlexRay Frames
Oscilloscope in asynchronous mode
Triggering on the FlexRay Time Schedule
Triggering on FlexRay Errors
All Errors
Multiple errors exist
For I2C decode setup see
To use I2C triggering
Clock
Start Address Ack Data
Frame Start Addr7 Read Ack Data or Frame Start Addr7
Frame Start Addr7 Read Ack Data Ack Data2 or Frame
Write Address R Ack1 Address Ack2 Data
1st byte 2nd byte
26th clock edge
Series Oscilloscope User’s Guide 169
To use Nth Edge Burst triggering
Idle Time Trigger
Nth Edge Burst trigger
Edge
Assign Channels Edge Select
To use LIN triggering
For LIN decode information see
Sync
Field
Signal Condition Baud rate
LIN trigger
Source Signal Sample Standard
Menu Baud rate Point Selector Break
Find? Trigger on? Reset on? Yes
To use Sequence triggering
Start Yes
Sequence Selected
Term
Define the Find stage
Edge Pattern 1 and Edge
Define the Trigger on stage
Edge Pattern 2 and Edge Nth Edge Nth Edge 2 no re-find
Define the optional Reset on stage
Edge 1 or Pattern 1 and Edge Timeout
Adjust the trigger level
To use SPI triggering
For SPI decode information see
Framing, or Data channel
Bit Set all
Value Data bits
To value
Clock Data Frame by
Channel Slope Condition
Series Oscilloscope User’s Guide 185
186
Resetting all bits in the serial data string to one value
To use TV triggering
Selected Trigger Channel
Source Sync
Channel Polarity
Provide Correct Matching
Standard Type Sync Pulse
190
Example exercises
To trigger on a specific line of video
Line numbers for each EDTV/HDTV video standard
Video standard Field Alt Field
LineAlternate
Alternate Triggering
To trigger on all sync pulses
Triggering on All Lines
To trigger on a specific field of the video signal
Triggering on Field
To trigger on all fields of the video signal
Triggering on All Fields
To trigger on odd or even fields
Series Oscilloscope User’s Guide 197
Half-field holdoff time
Standard Time
For UART/RS232 decode setup see
To use UART/RS232 triggering
Trigger softkey
200
Series Oscilloscope User’s Guide 201
202
Series Oscilloscope User’s Guide 203
USB trigger Trigger on Signal + source Source
To use USB triggering
End of packet trigger Bus Idle
Data source
Series Oscilloscope User’s Guide 205
Trigger Out connector
Triggers
Source frequency
Source frequency/8
Making Measurements
Post Acquisition Processing
To use the XY horizontal mode
Example of centering a signal on the display
Signal centered on the display
Cursors set on displayed signal
Series Oscilloscope User’s Guide 211
Signals are 90 out of phase
Math Functions
Math Operating Hints
Math scale and offset
Math Scale and Offset are Set Automatically
Math function Units
Multiply
Multiply
Channel Waveform Math Function Scale
Subtract
Subtract
Channel Waveform Scale
Differentiate
Channel Dt waveform Math Source Function Select Scale
Integrate
Integrate and Signal Offset
Channel Dt waveform Channel 1 0 Scale Source Select
FFT Measurement
FFT Units
DC Value
Aliasing
Aliasing
Source Frequency Center Preset Span
FFT Operation
Spectral Leakage
Select Span Frequency Center
Window
Offset
Scale and offset considerations
FFT Measurement Hints
FFT measurements
Series Oscilloscope User’s Guide 229
Square Root
Channel √ waveform Scale √
Source Select
Cursor Measurements
Series Oscilloscope User’s Guide 233
234
Series Oscilloscope User’s Guide 235
Cursor Examples
Cursors measure frequency of pulse ringing
Series Oscilloscope User’s Guide 237
Moving the cursors together to check pulse width variations
Phase and Delay
Automatic Measurements
Time Measurements
Voltage Measurements
Settings Thresholds
To make an automatic measurement
Preshoot and Overshoot
Erase all Additional
Changing default thresholds may change measurement results
To set measurement thresholds
Source Threshold Lower Middle Upper Return to Select Type
Absolute threshold hints
Time Measurements
FFT measurements
Rise Time
Thresholds Upper Middle Lower + Width
Counter
Duty Cycle
Frequency
Period
Isolating event for Frequency measurement
Fall Time
Rise Time
+ Width
Width
Delay and Phase Measurements
Delay
Source Delay
At Min
Phase
Delay Measurement
Period Source Delay
Voltage Measurements
Math Measurements and Units
Maximum Top Amplitude Peak-Peak
Minimum
Digital channel voltage measurements
Amplitude
Average
Base
Maximum
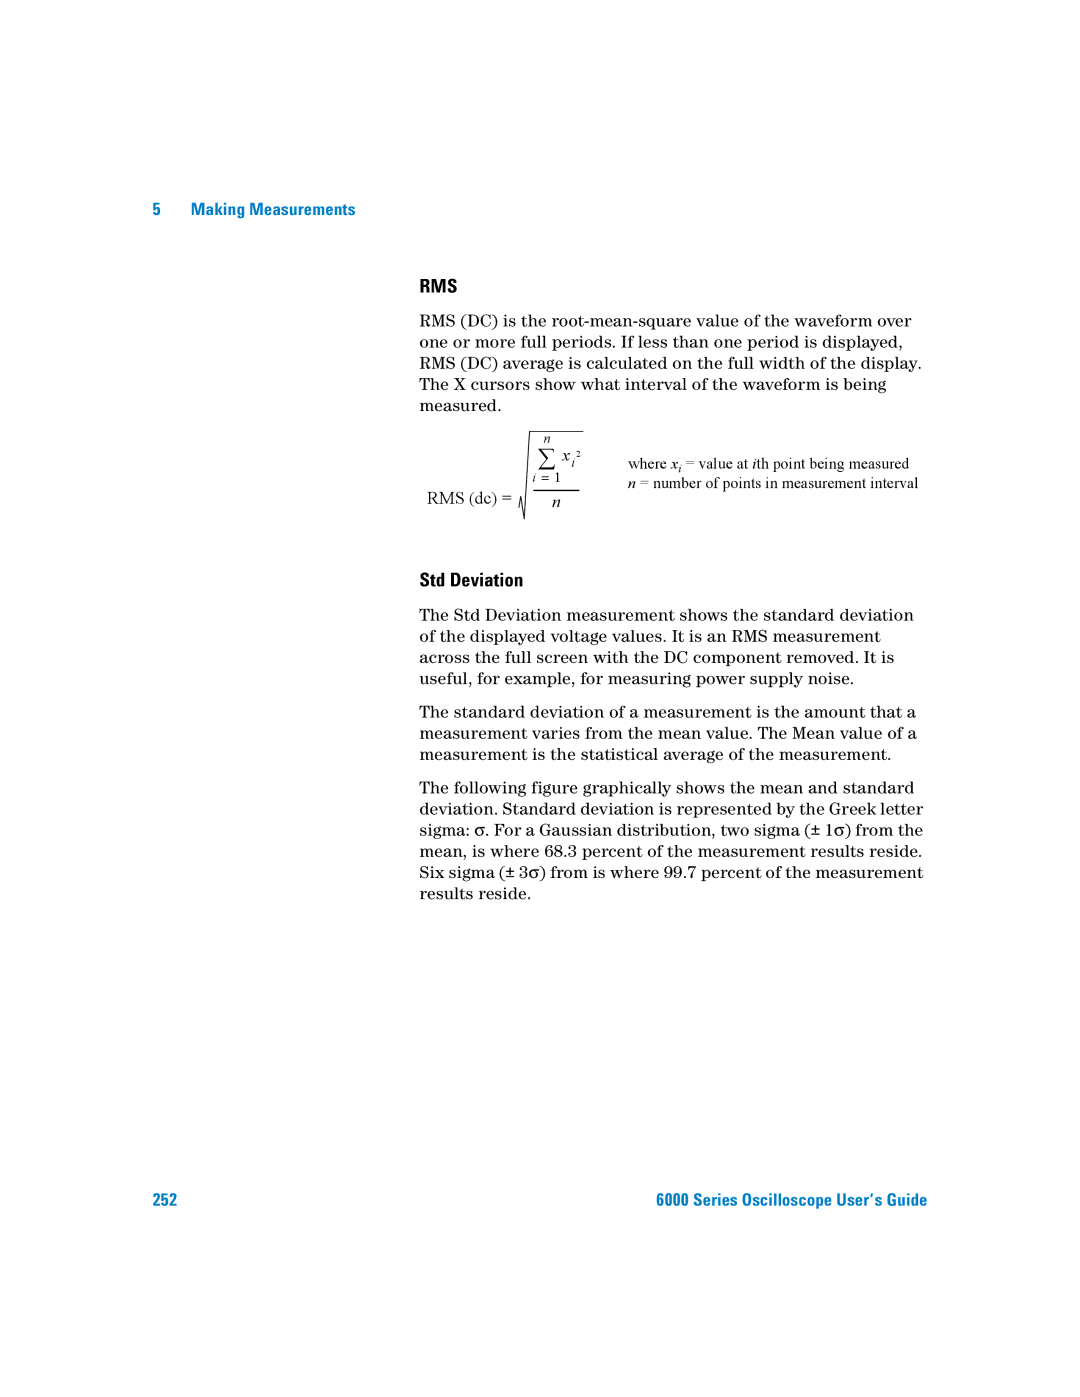
RMS
Std Deviation
∑ xi
Top
Isolating area for Top measurement
Overshoot and Preshoot Measurements
Preshoot
Local Maximum Preshoot Top
Preshoot
Overshoot
Overshoot Local Maximum Top Base Local Minimum
Displaying Data
Antialiasing
Pan and Zoom
Zoom
To pan and zoom a waveform
To set the waveform expansion reference point
Using the XGA video output
Antialiasing
Display Settings
Infinite persistence
Grid intensity
Vectors connect the dots
Accumulating multiple acquisitions
Clearing stored infinite persistence waveforms
Varying the intensity to view signal detail
Using Vectors Display menu
Amplitude Modulation with Noise Shown at 100% Intensity
Selecting the Acquisition mode
Acquisition Modes
At Slower Sweep Speeds
Normal Mode
Peak Detect Mode
High Resolution Mode
Agilent 6000 Series Model Numbers and Sampling Rates
Averaging Mode
# Avgs=1
GSa/s Sample Rate
# Avgs
To use the Averaging mode
Random noise on the displayed waveform
Realtime Sampling Option
128 Averages used to reduce random noise
Realtime Sampling and Oscilloscope Bandwidth
Using Serial Decode
For I 2C triggering setup see
Display Decode Signal Return to Mode Setup menu
To decode I2C data
Decode I 2C data while LIN triggering is selected
Series Oscilloscope User’s Guide 273
Interpreting Decoded I2C Data
Series Oscilloscope User’s Guide 275
For SPI triggering setup see
To decode SPI data
Signal Clock Frame by
Signal Edge Option
278
Interpreting Decoded SPI Data
280
For can triggering setup see
To decode can data
Rate Sample Return to Signal Source Point
Series Oscilloscope User’s Guide 283
Interpreting Decoded can Data
Active Error Frame red
CRC blue Data white Data Length Code blue
Can Totalizer
Types of Frames
Counters
Total Frame Overload Error Frame
Count Frame Count Percentage
For LIN triggering setup see
To decode LIN data
LIN trigger Decoded LIN data
Baud
Sync Return to Source Rate Sample Standard Break
Point Selection
290
Series Oscilloscope User’s Guide 291
Interpreting Decoded LIN Data
Series Oscilloscope User’s Guide 293
Display Decode VPT1000 Reset Return to Mode Menu Counters
To decode FlexRay data
Series Oscilloscope User’s Guide 295
Interpreting Decoded FlexRay Frame Data
Trailer
Header CRC blue
Interpreting Decoded FlexRay Time Data
Time-Schedule Decode
FlexRay Totalizer
Counters softkey
Total Frame Null Frame
Count
Percent
For UART/RS232 triggering setup see
To decode UART/RS232 data
Selected
Signal Bus Base Value
UART/RS232 trigger Define Display Framing
302
Series Oscilloscope User’s Guide 303
Interpreting Decoded UART/RS232 Data
Series Oscilloscope User’s Guide 305
UART/RS232 Totalizer
Tx Frame Rx Frame
Count Percent
To reduce the random noise on a signal
HF Reject
Press Mode/Coupling&HF Reject
DB down point
LF Reject
Noise rejection
Press Mode/Coupling&Coupling&LF Reject
DB down point Pass Band
Series Oscilloscope User’s Guide 309
Using peak detect mode to find a glitch
15 ns Narrow Pulse, 20 ms/div, Peak Detect Mode
Series Oscilloscope User’s Guide 311
How AutoScale Works
Undo AutoScale
Preserving the Acquisition Mode During AutoScale
Specifying the Channels Displayed After AutoScale
314
Saving and Printing Data
Printing the oscilloscope’s display Supported Printers
Printing the oscilloscope’s display
Print options
Choose Options Select
Printer Factors Color or
Selecting print options
Palette
Graticule Not Inverted
Supported Printers
Series Oscilloscope User’s Guide 319
Saving oscilloscope data
Can be saved to
Type of Data
Selecting a destination for your saved data
Selecting a file name
Overwriting a file
Creating a new file name
Series Oscilloscope User’s Guide 323
Waveform Trace and Oscilloscope Setup
Display Image and Waveform Data Files
Display Image and Waveform Data File Formats
Choosing save settings
Factors
Invert Graticule Colors
Palette
Length Control
To save a waveform and/or setup to a USB device
To recall waveform trace and/or oscilloscope setup
Trace, or Trace and Setup
File explorer
Regarding USB Ports
To use the file explorer
Press Utility&File Explorer
Secure Environment Mode Option
Ordering the Secure Environment Mode Option
Ordering the Secure Environment Mode Option
To set up the I/O port
To supply a sample clock to the oscilloscope
Software and firmware updates
Utility&Options&Features&Show license information
Utility&Service&About Oscilloscope
Upgrading to an MSO or adding memory depth
To set up the I/O port
Using the 10 MHz reference clock
Sample clock and frequency counter accuracy
Supplying an external timebase reference
To supply a sample clock to the oscilloscope
Press Utility&Options&Rear Panel&Ref Signal
Reference signal locked MHz input mode selected
To check warranty and extended services status
To synchronize the timebase of two or more instruments
To clean the oscilloscope
To return the instrument
Input Impedance
Series Oscilloscope User’s Guide 341
Probe Grounding
Impedance versus Frequency for Both Probe Circuit Models
Vn Common Mode
Probe Probe N
Best Probing Practices
Digital Probe Replacement Parts
To replace digital probe leads
Part Number Description
Binary Data .bin
Binary Data in Matlab
Binary Header Format
File Header
Waveform Header
348
Series Oscilloscope User’s Guide 349
Example Program for Reading Binary Data
Waveform Data Header
Examples of Binary Files
Single Acquisition Multiple Analog Channels
Single Acquisition All Pods Logic Channels
Minimum and Maximum Values in CSV Files
1000ns ⋅ 4Gsa ⁄s = 4000samples
354
Power and Environmental Conditions
Power Requirements
Measurement Category
Measurement Category
Measurement Category Definitions
Transient Withstand Capability
With 50 Ω input 5 Vrms
Environmental Conditions
Specifications
Specifications
Acknowledgements
Contact us
Americas
Asia Pacific
Europe
362
Index
Index
Series Oscilloscopes User’s Guide 365
Modify softkey, 39 MSO, 4
Series Oscilloscopes User’s Guide 367
USB