4.10Statistics Chart
The Statistics Chart pages provide network flow in different charts. You can specify the period time to refresh the chart. You can monitor the network traffic amount in different graphic chart by these pages. Most
Click Refresh Rate to set the period for retrieving new data from the switch. You can differentiate the statistics or ports by selecting Color. Finally, click on Draw to let the browser to draw the graphic chart. Each new Draw will reset the statistics display.
4.10.1 Traffic Comparison
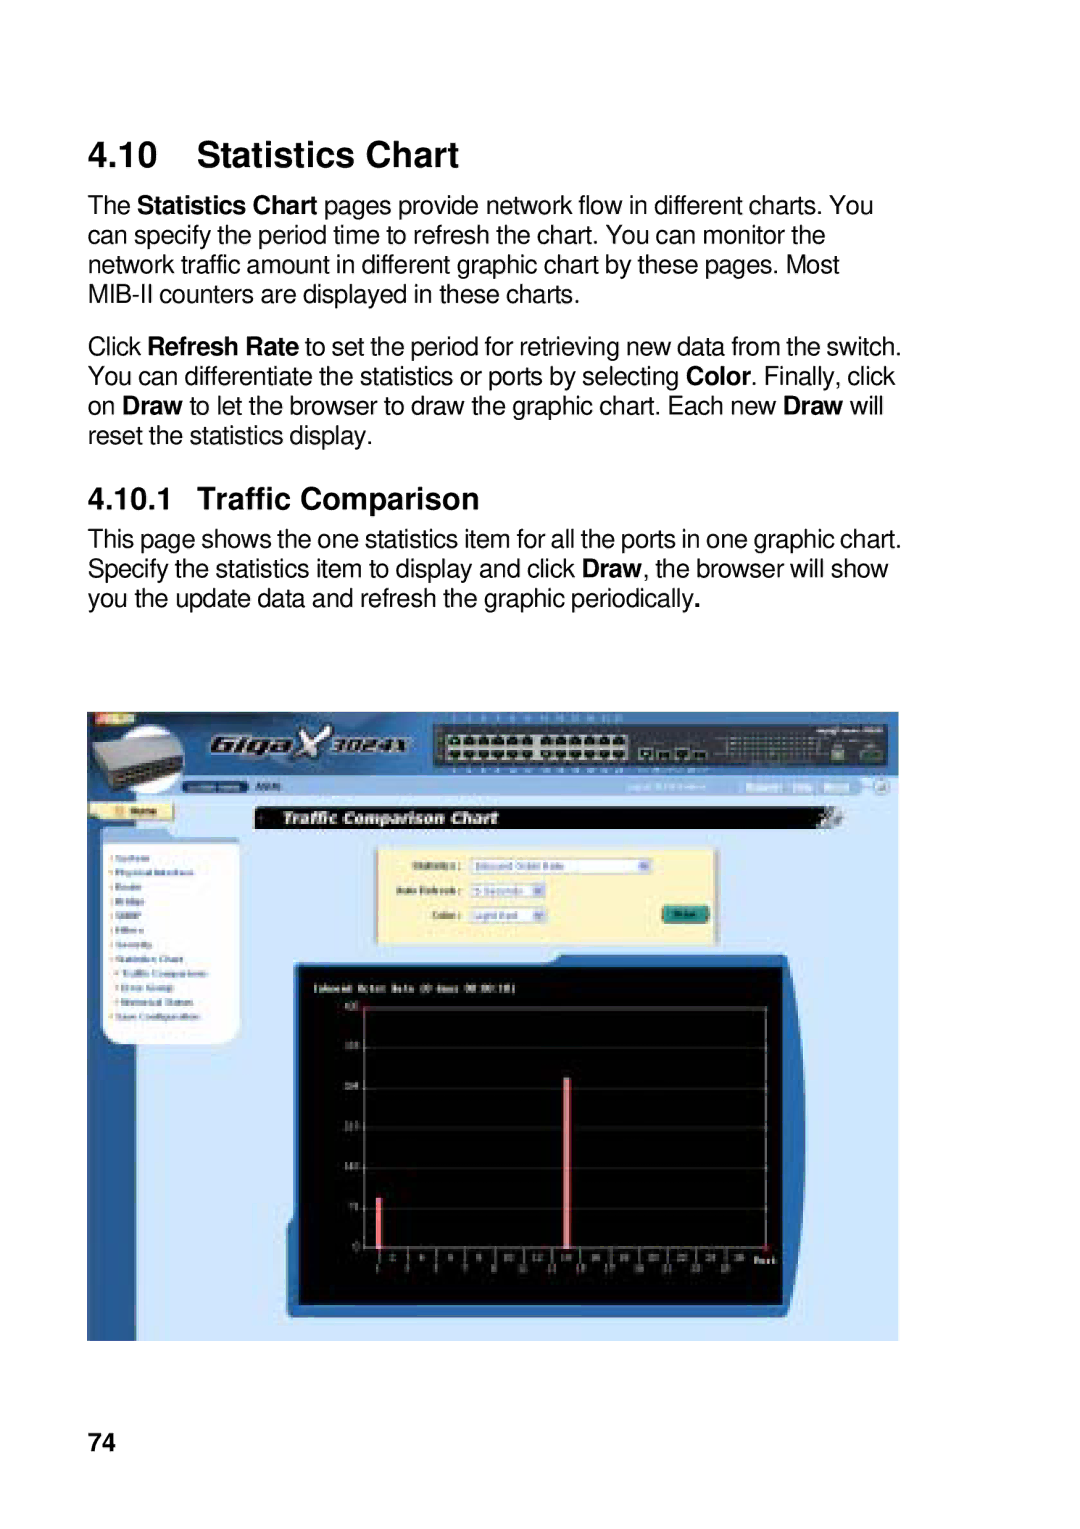
This page shows the one statistics item for all the ports in one graphic chart. Specify the statistics item to display and click Draw, the browser will show you the update data and refresh the graphic periodically.
74