QUANTUM
Getting Started Section 1
1.2 Front Panel (cont.)
Analog Level Meters
These meters monitor analog input and output. For more on meters refer to Section 3.
TSE™ Audio Level Meters
These meters monitor the level of Tape Saturation Emulation. Refer to Type IV™ in Section 3.
LCD Display
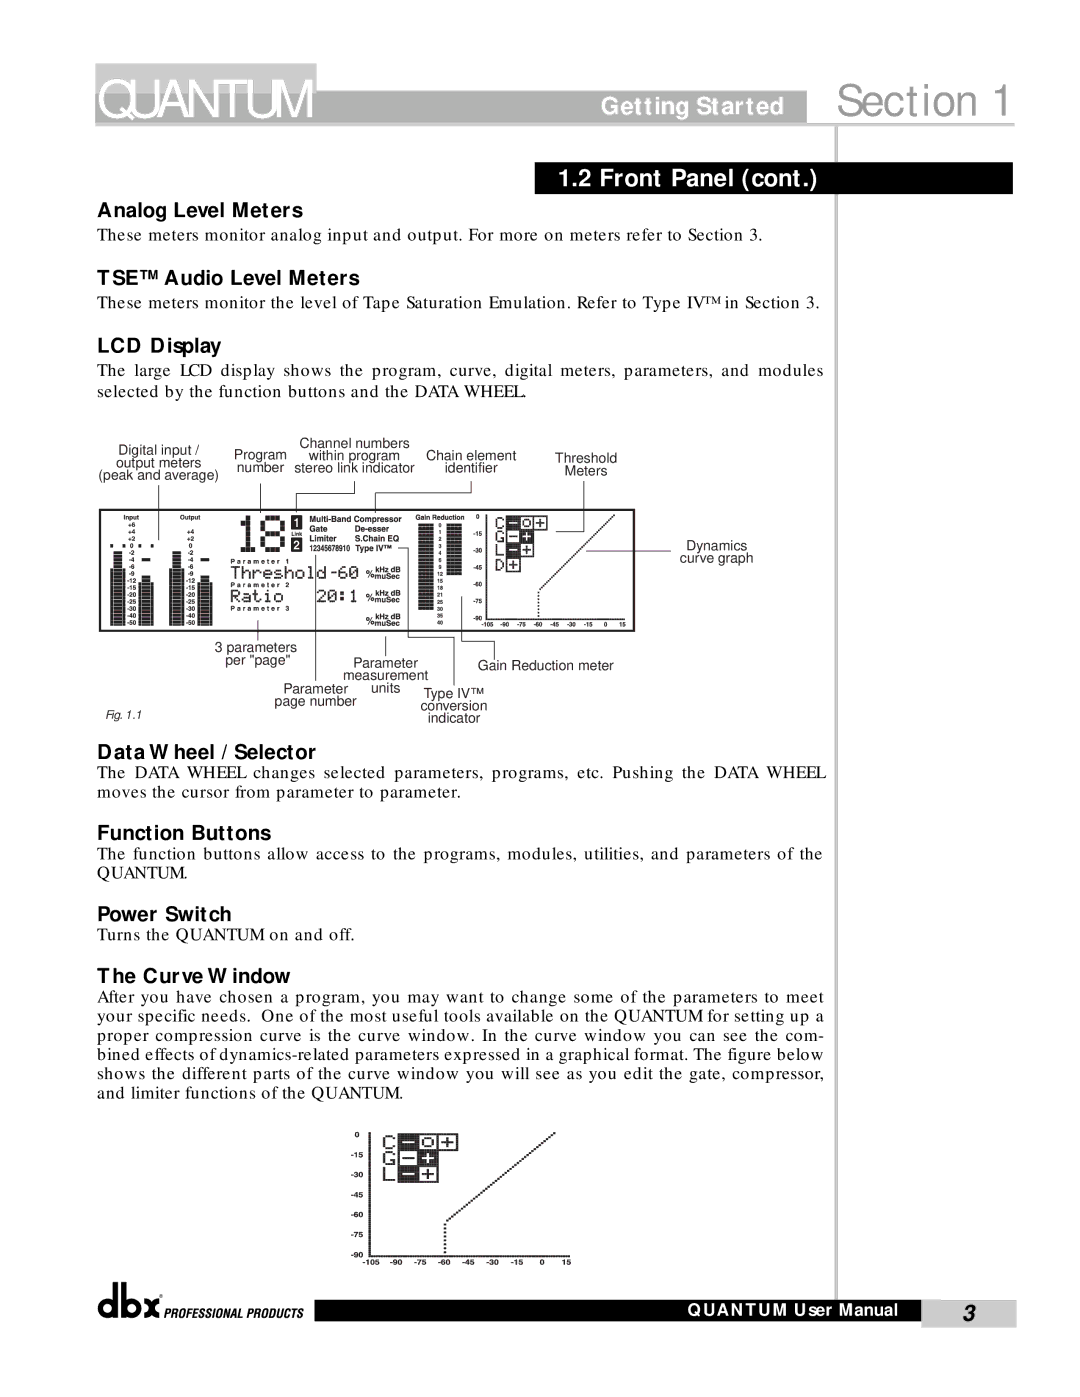
The large LCD display shows the program, curve, digital meters, parameters, and modules selected by the function buttons and the DATA WHEEL.
Digital input / | Program | Channel numbers |
|
|
|
| ||||||
within program | Chain element | Threshold | ||||||||||
output meters | ||||||||||||
number | stereo link indicator | identifier | Meters | |||||||||
(peak and average) | ||||||||||||
|
|
|
|
|
|
|
|
|
| |||
|
|
|
|
|
|
|
|
|
|
|
| |
|
|
|
|
|
|
|
|
|
|
|
| |
|
|
|
|
|
|
|
|
|
|
|
| |
|
|
|
|
|
|
|
|
|
|
|
| |
|
|
|
|
|
|
|
|
|
|
|
| |
|
|
|
|
|
|
|
|
|
|
|
| |
Dynamics
curve graph
|
|
|
|
|
|
|
|
|
|
|
|
|
|
|
|
|
|
|
|
|
|
|
|
|
|
|
|
|
|
|
|
|
|
|
|
|
|
|
|
|
|
|
|
|
|
|
|
|
|
|
|
|
|
|
|
|
|
|
|
|
|
|
|
|
|
|
|
|
|
|
|
|
|
|
| 3 parameters |
|
|
|
|
|
|
| |
|
|
|
|
|
|
|
| per "page" | Parameter |
|
| Gain Reduction meter | ||||
|
|
|
|
|
|
|
|
| measurement |
|
|
| ||||
|
|
|
|
|
|
|
|
| Parameter | units | Type IV™ | |||||
|
|
|
|
|
|
|
|
| page number | |||||||
|
|
|
|
|
|
|
|
| conversion | |||||||
Fig. 1.1 |
|
|
| |||||||||||||
|
|
| indicator | |||||||||||||
Data Wheel / Selector
The DATA WHEEL changes selected parameters, programs, etc. Pushing the DATA WHEEL moves the cursor from parameter to parameter.
Function Buttons
The function buttons allow access to the programs, modules, utilities, and parameters of the
QUANTUM.
Power Switch
Turns the QUANTUM on and off.
The Curve Window
After you have chosen a program, you may want to change some of the parameters to meet your specific needs. One of the most useful tools available on the QUANTUM for setting up a proper compression curve is the curve window. In the curve window you can see the com- bined effects of
®
QUANTUM User Manual | 3 |
|
|
