MODEL | SECTION 5.0 |
| DISPLAY AND OPERATION |
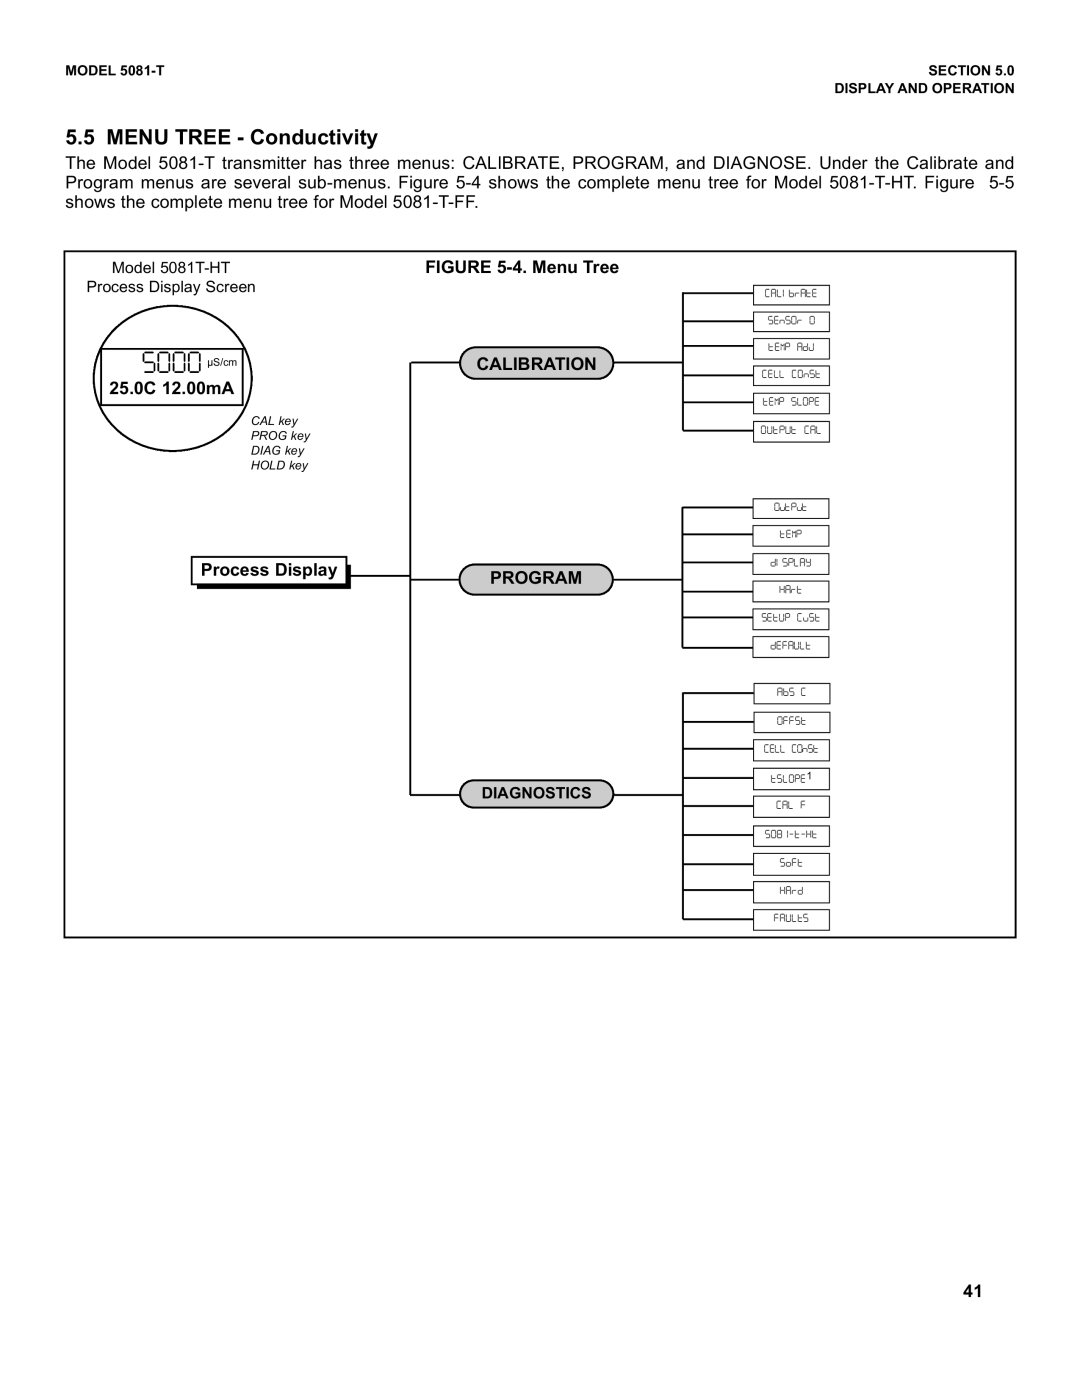
5.5 MENU TREE - Conductivity
The Model
Model
Process Display Screen
'""" µS/cm
25.0C 12.00mA
CAL key
PROG key
DIAG key
HOLD key
Process Display 

FIGURE 5-4. Menu Tree
CALIBRATION
PROGRAM
DIAGNOSTICS
<1P<9S!"
/1[[!/9P<U
U17:!<[9:1
9VU:VU
U17:
<1U>:!/V<=
922<U
/1[[!/9P<U
U<[9:11
'"*#\=\4U
<Q2U
2D>[=T
41