User’s Guide – version 3.1.3 | NetFlow Tracker |
285 | (GMT+12:00) | Fiji, Kamchatka, Marshall Is. |
300 | (GMT+13:00) | Nuku'alofa |
Specifying the chart sample size
When you create a
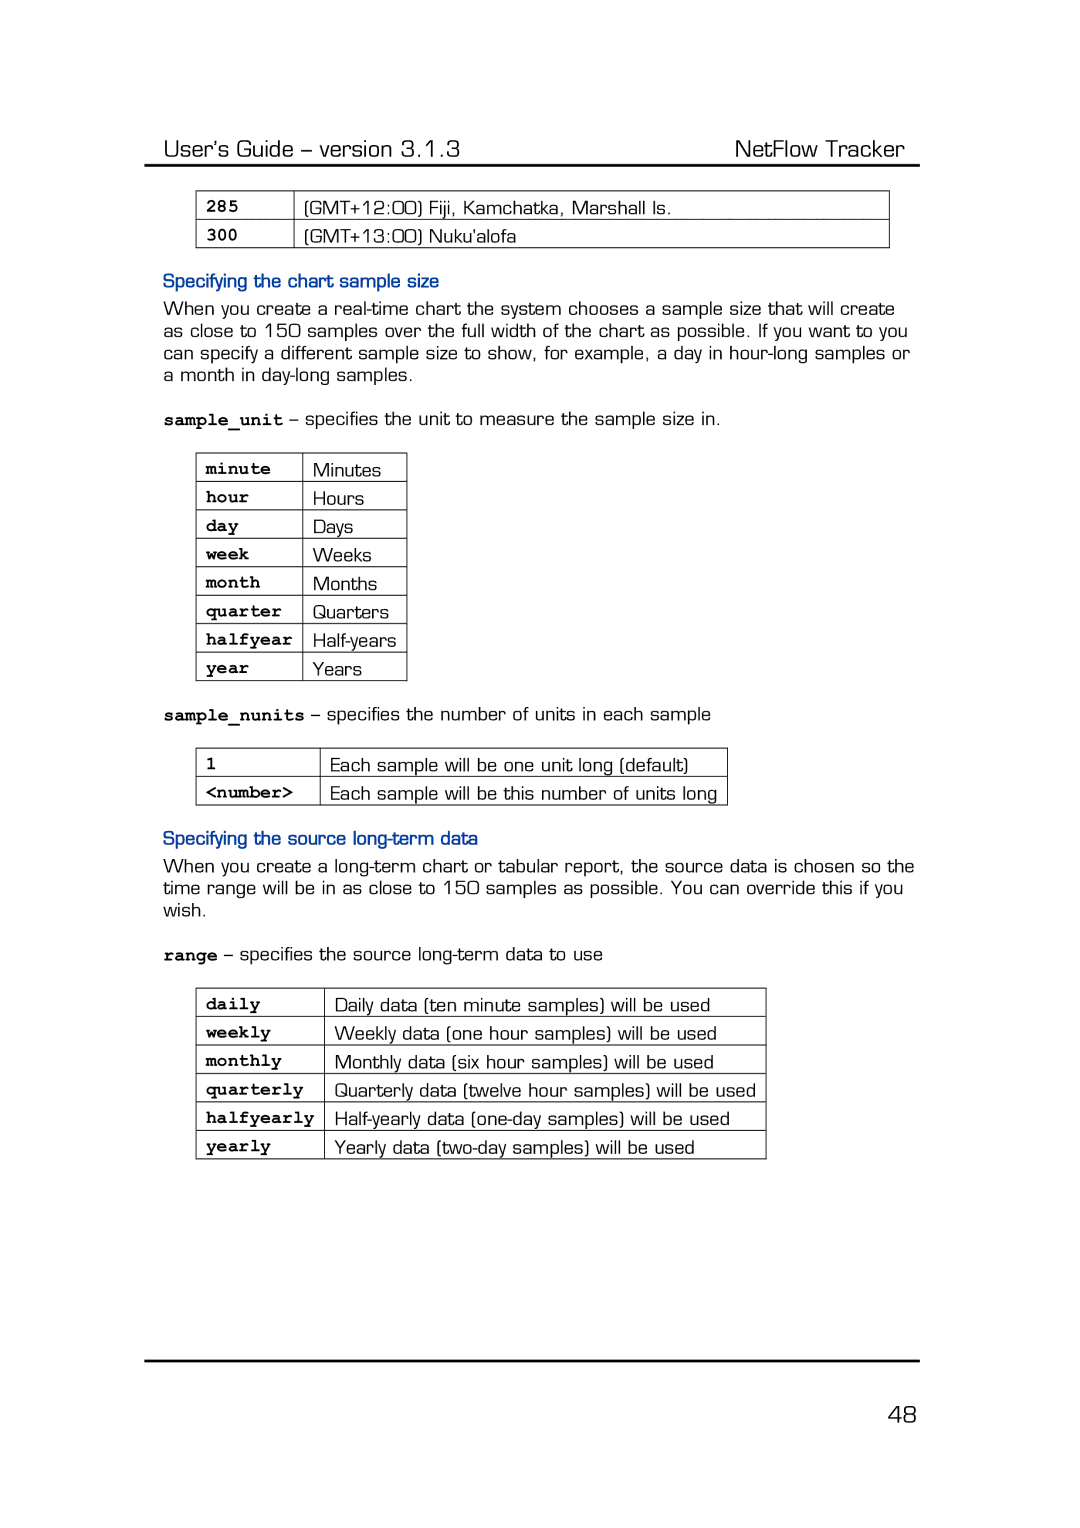
sample_unit – specifies the unit to measure the sample size in.
minute | Minutes |
hour | Hours |
day | Days |
week | Weeks |
month | Months |
quarter | Quarters |
halfyear | |
year | Years |
sample_nunits – specifies the number of units in each sample
1Each sample will be one unit long (default)
<number> | Each sample will be this number of units long |
Specifying the source long-term data
When you create a
range – specifies the source
daily | Daily data (ten minute samples) will be used |
weekly | Weekly data (one hour samples) will be used |
monthly | Monthly data (six hour samples) will be used |
quarterly | Quarterly data (twelve hour samples) will be used |
halfyearly | |
yearly | Yearly data |
48
