User’s Manual
TransPort Model PT878
Page
TransPort Model PT878
No content intended for this page proceed to next
Information Paragraphs
Safety Issues
Auxiliary Equipment
Local Safety Standards
Waste Electrical and Electronic Equipment Weee Directive
Environmental Compliance
No content intended for this page proceed to next
Features and Capabilities
Programming Site Data
Creating and Managing Sites
Programming Meter Settings
Logging Data
Servicing the PT878
Diagnostics and Troubleshooting
Appendix D. Ultrasonic Thickness Gauge Theory of Operation
Overview
Features and Capabilities
Flowcell
System Description
Electronics Package
Theory of Operation
PT878 and Accessories
Initial Setup
Connection Locations
Making Electrical Connections
Transducer Connections
Power Connections
Input/Output Connections
Description
Infrared Wireless Interface
Charging and Storing the Batteries
Caring for the PT878 Batteries
Replacing the Batteries
Icon Battery Status
Disposing of Batteries
Battery Location
Powering on and OFF
2000/11/30 0953 AM
Velocity, ft/s Signal, dB Delta-T, ns
Velocity, ft/s
Signal, dB
Using the Screen and Keypad
Screen
Icons in the System Tray Function Meaning
Keypad
PT878 Keypad
Help
No content intended for this page proceed to next
Programming Site Data
Entering the Program Menu
Volume, l/s
Vel
Entering Transducer Parameters
Wedge Ang Wedge Tmp Wedge SS 1219.2 Cancel
Transducer/Pipe
Transducer
Entering Transducer Parameters
#41
Pipe #40 Fluid Path Lining
#42
#43
Parameters for Special Transducers
Critical Angle Exceeded Check Angles, Soundspeed
High Angle Error Message Window
Is Too Low Valid range is from 25.000 to
Low Angle Error Message Window
Transducer Spacing Change Window
Transducer Spacing has changed New Spacing Inches 24.493 mm
Entering Pipe Parameters
Confirming Entries
Pipe
Other
None
Rolled
Annealed or Rolled
70% Cu 30% Ni or 90% Cu 10% Ni
Is Too High Valid range is from 3330.052 to 24000.000 ft/s
Transducer/Pipe Invalid Value Too High
Transducer Spacing Change Window
Entering Pipe Parameters
Entering Pipe Lining Parameters
Sound Speed 2000 Thickness Cancel
Transducer Pipe Lining Fluid Path Material
Tar/Epoxy
Entering Pipe Lining Parameters
Transducer Pipe Lining
Entering Fluid Types and Speeds
Fluid
Tracking Windows?
Energy On
Other Water 0-260C Oil Sea Water Oil 22C
Signal Path Window
Entering the Signal Path Parameters
Path Parameters for Clamp-On Transducers
Path Parameters for Wetted Transducers
Energy Options
Entering the Energy Option Parameters
Energy Option
Entering the Energy Option Parameters
Inputs
Entering Inputs in the Energy Option
Entering Inputs in the Energy Option
Energy Option Inputs
Entering Custom Cp Data in the Energy Option
Custom Cp
Kelvin KJ/kg/K Cancel
Edit Density
Kelvin Kg/m3 Cancel
Programming Site Data
Entering General-Purpose Analog Inputs
Entering Analog Inputs
Delete Cancel
Analog Inputs Option Window Energy Option Activated
Entering Analog Inputs in the Energy Option
Entering Analog Inputs in the Energy Option
Analog Output
Entering the Analog Output
Velocity
Diagnostics
Entering the Analog Output
Digital Output
Entering the Digital Output
If you selected Pulse Totalizer
If you selected Frequency
Stopwatch Totalizer
Set User Function
Entering User Functions
User F1
Label Units Sym Dec Delete Check Done
Text Creation Window
Entering User Functions
Tan Asin
Abs Exp Inv Log
Atan
Entering Reynolds Correction
Entering Correction Factors
Correction Factors
Reynolds Correctio Calibration FactorInputs
Entering Reynolds Correction
Calibration Factor Window
Entering a Calibration Factor
If you entered Single
Edit KFactor Table
Data Source KFactor Cancel
Entering a Calibration Factor
Site
Creating and Managing Sites
Site Manager
Site Manager
Site Manager
File
Site Manager Menu
Site
Creating a New Site
New Site
Use the selected site ‘DEFAULT.SIT’ as a template?
Opening an Existing Site
DEFAULTRe InfoDEFAULT ResOpen File Default Are You Sure?
File
View Yes
Saving a Site
Save the current site DEFAULT.SIT?
Save Site
Saving a Site with a Different Name
Delete Cancel
Save Current Site
Renaming a Site
Refreshing a Site
Delete Confirmation Window
Deleting a Site
Creating a Site Message
File Site Sort Message Info Defaultsit
Delete Cancel
Transferring a Site File to a PC
Printing a Current Site
Transferring a Site File in Text Format to a PC
Transferring a Site to a PC
QuickBeam Window
Transferring a File from a PC to the PT878
Infrared Icon in System Tray
Wireless Link Icon
Listing Files in Chronological Order
Listing Files by Name
File Site
Sort
ABC.SIT 2000/11/30 0953 AM
Displaying and Configuring Data
Format View Measurement
Format Option
Format Decimal Places Fixed Decimal Cancel
Number Format
Format Option
Screen After Format Change
View Option
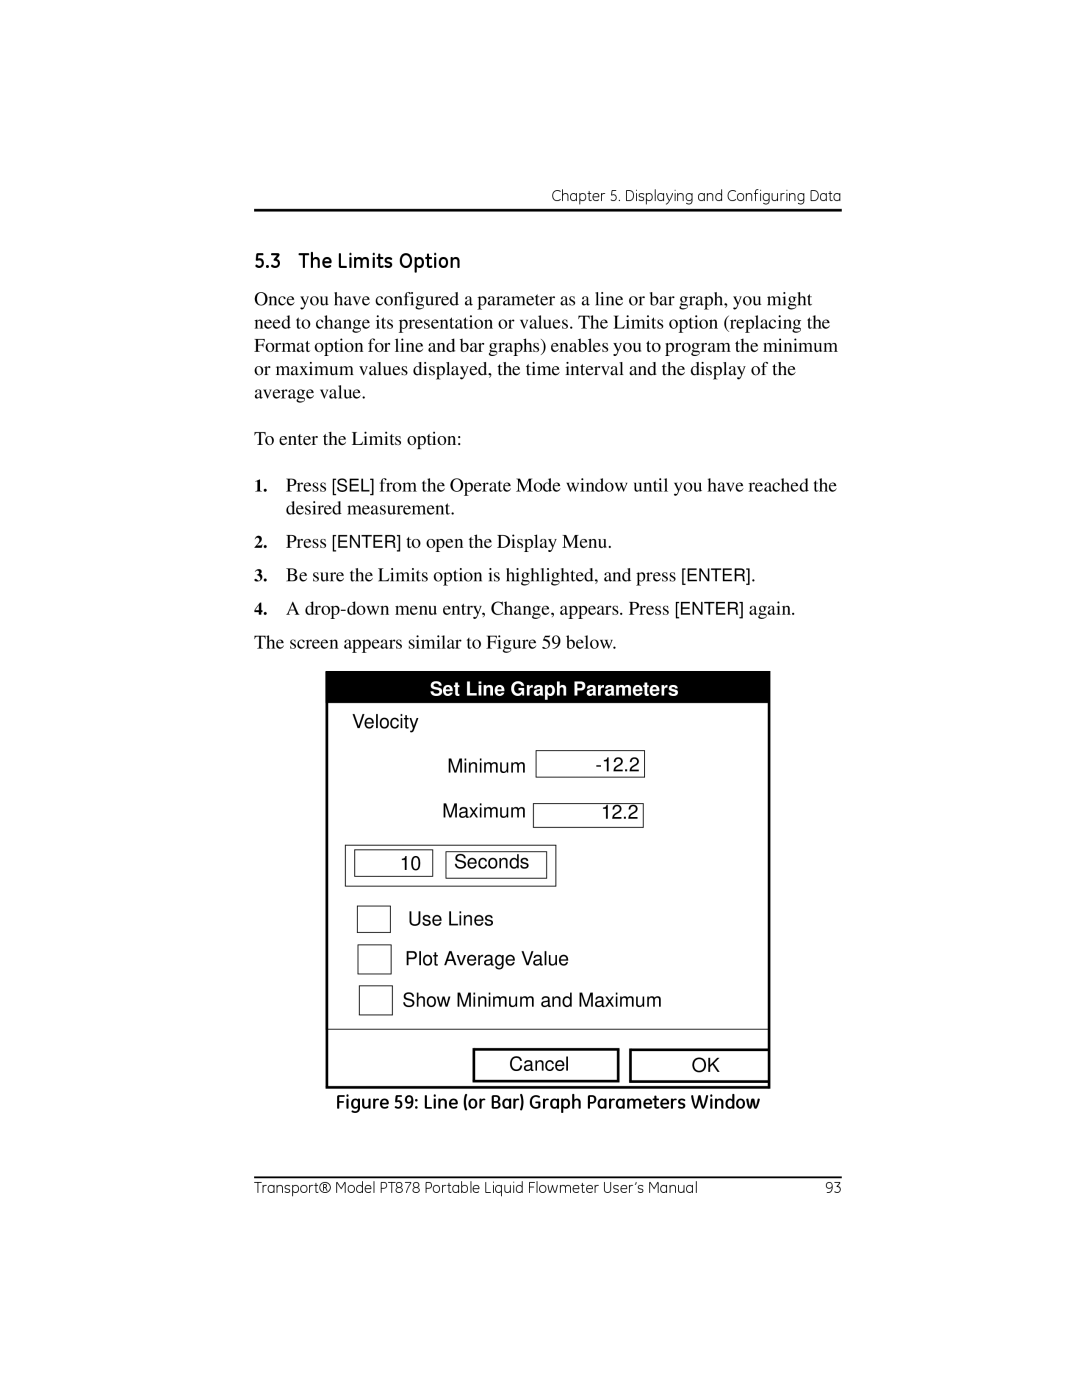
Set Line Graph Parameters
Limits Option
Limits Option
Measurement Option
Measurement Menu Window
Manager
Customizing the Display Screen
Specifying the Number of Displayed Parameters
Velocity, ft/s
FKeys
Customizing Softkeys
Select a menu item
Configure FKey
Display Screen with Modified Softkey
Contrast
File Manager
Managing Files The Drive Manager
Sort Info SYSLOG.MET
03/15/01 103920
File Manager Menu
Sort Transfer Info SYSLOG.MET
IRInbox Folder Transferred File
Transferring a File to a PC
QuickBeam Window
Infrared Icon in System Tray
Refreshing a File
Wireless Link Icon
Deleting a File
DEFAULTRe InfoDEFAULT ResDelete Site ‘A.SIT’?
File Delete Confirmation
GLOBAL.By Date
File Sort
09/04/02
Bytes free Refresh Exit
To return to Operate Mode, press ESC or F3 Exit
Accessing Meter Data -The About Option
Programming Meter Settings
Meter
Entering the Meter Menu
Units
Units English Metric Date 2000/11/1 Time 100853 Cancel
Meter Settings
Selecting Measurement Units
Battery Charger
Battery Charger
Condition Battery
8Ahr NiCd
Entering Date and Time
Entering Date and Time
Display Options
Changing Date and Time Appearance
Display
Locale
Changing Date and Time Appearance
Changing Date and Time Appearance
Display Options
Adjusting the Contrast
Display
Setting Backlight Timeout
Change Language
Changing the Display Language
650.0
Changing Communications Settings
Communications
None Cancel
Changing Communications Settings
Reset Both
Resetting Forward and Reverse Totals
Totals
User Function Tables
Setting Up User Tables
UserTable1 Delete Cancel
Edit User Table
UserTable1 Cancel
Taking a Bitmap Capture of a Current Screen
Logging Data
New Log Test Units
Entering the Logging Menu
Log Manager
Log Manager
New
File Menu
Ed Log State Finished
Rename S03/01/01
Create New Log
Setting up a New Log
Secs
Cancel Activate
Setting up a New Log
Log Measurements Window
General Measurements
Select Measurement Window
Copying Cloning a Selected Log
Deleting a Log
Renaming a Log
Deleting All Logs
DEFAULTRe InfoDEFAULT ResDelete Log ‘555.LOG?’
Refreshing the Log Manager Screen
Log Manager FileDelete
52.0 Start Date 2003/03/01 End Date
Printing a Log
Enter Time
Start Time 132341 PM End Time 135341 PM
Transferring a Log to a PC
Log
Log Menu
Start
Restarting a Log
Stopping Pausing a Log
Ending a Log
Restarting All Logs
Stopping All Logs
Ending All Logs
View All Sites
View
View Menu
Details
Log Info
Displaying Log Details
AAA.LOG Velocity, ft/s
Displaying Log Data in Graphical Form
297 289 2001/03/01 132341 PM 135341 PM Scale Time Exit
Axis Window
AAA.LOGY-AxisDew Point, C
52.0
123.LOG
Displaying Log Data in Spreadsheet Form
Listing Logs by Name
Sort Menu
Listing Logs in Chronological Order
Sort By Name
Servicing the PT878
Test
Entering the Service Menu
Printing Reports
Reports Drive Contents
Current Site
Printout of a Typical Drive Report
Setting up the Thickness Gauge
Material Window
Thickness Gauge Measure
Entering the Material and Soundspeed
Display Graph Velocity Zero Material
Measuring Thickness in Numeric Format
Thickness, mm
Signal
Displaying the Receive Signal in Graphical Format
Graph
Velocity Zero Material
Graph Window in Zoom Format
Out Display
Display Graph Velocity
Calibrating the Thickness Gauge Transducer
Zero
Dual-Point Calibration
Dual-Point Calibration
Soundspeed Window
Calculating Velocity Pipe Material Soundspeed
Display Graph
Press Set to Commit Value Calculated 22129. Current Cancel
Zero Material
Set
Programming the Thickness Gauge
Programming
Thickness Gauge Setup
Programming the Thickness Gauge
Diagnostics Window
Displaying Diagnostic Parameters
Calibrating the Analog Output
Calibrating the Analog Output and Inputs
Analog Output
Enter
Calibrating Inputs
Input# Low Read High 20 mA Calibrate Reset Cancel
Calibrate/Test I/O
Analog Output
Calibrating Inputs
Signal Setup
Setting up Signal Parameters
Signal Para
Setting up Signal Parameters
Setting up Signal Parameters
Signal Para
Setting up Peak Detection
Peak Detect
Pulse/Code
Enter
Transmit Code Auto Cancel
Signal Para Peak Detect
Selecting the Transmit Code
Pulse/Code
Signal Error Limits
Setting Error Limits
Setting Error Limits
Setting Error Limits
Test Option
Service
Reports
Test Screen
Functioning Test Screen
Testing the Screen
Test Keys Window
Testing the Keys
Factory Defaults Restart your meter
Testing the Watchdog Timer Circuit
Press ‘No’ to cancel the test
This test should automatically
Direction Percent Gain Upstream Stopped
Setting Impulse Response
Taking Wave Samples for Diagnosis
Applying a Stored Signal for Diagnosis
Service Battery Form
Testing the Battery
Factory Defaults
Resetting to Factory Default Parameters
Updating PT878 Software
Choose ‘Cancel’ to exit or ‘OK’ to continue
Update Flash
Updating Software Via IrOBEX
Updating Software Via IrCOMM
12.2a Setting up the PC
12.2b Installing New Software
12.2b Installing New Software
Send File Window in the Transfer Menu
No content intended for this page proceed to next
Diagnostics and Troubleshooting
Error Messages
Error Code Messages
Velocity Range
Diagnostic Parameters
Displays raw upstream signal correlated With transmit signal
Fluid Problems
Flowcell Problems
Pipe Problems
Wetted Transducer Problems
Transducer Problems
Physical Damage
Clamp-on Transducer Problems
Press Menu
Relocating Transducers
Overall Hardware Configuration
Specifications
Size/Weight
Enclosure
EMC
Electrical
Environmental
Operational Specifications
Transducer Clamp-On Ultrasonic Flow Transducers
Temperature Transducers
Available Options
Thickness Measuring Mode
Program Menu
Appendix A. Menu Maps
No content intended for this page proceed to next
Site
Program Menu with Pipe Option
YYYY/MM MM/DD DD/MM
Logging
Service
Page
Transducer Option
Lining Option
Fluid Option
Path Option
Energy Option
Analog Input Option
Analog Output Option
Digital Output Option
User Functions Option
Correction Factors Option
Communications Option
No content intended for this page proceed to next
Top View of 180 Transducer Installation
Appendix B. Measuring P and L Dimensions
Determining the Pipe Coupling Length
Appendix B. Measuring P and L Dimensions
No content intended for this page proceed to next
Guidelines for RTD Installation
Appendix C. Temperature Transmitter Installation
Assembling the Clamping Fixture
Mounting RTDs on the Pipe
Mounting the RTD to the Pipe
Connecting the RTD to the 4 to 20-mA Transmitter
Connection Locations
Connecting the Transmitter to the PT878
No content intended for this page proceed to next
Appendix D. Ultrasonic Thickness Gauge Theory of Operation
Factors Affecting Performance and Accuracy
Transducer
Transducer Positioning/Alignment
Taper or Eccentricity
Calibration
Acoustic Properties of the Material
Product Identification
Appendix E. Material Safety Data Sheet for Couplant
Hazardous Ingredients
Fire and Explosion Hazard Data
Physical Data nominal
Reactivity Data
Storage and Handling Information
Health Hazard and First Aid Data
Soundsafe
Control Measures
IrDA Compatibility of Windows Operating Systems
Appendix F. Establishing IR Communications
Windows 2000/XP
Appendix G. Glossary
Appendix G. Glossary
Appendix G. Glossary
Appendix G. Glossary
Index
Cont
Index
Index
Index
Index
Index
Cont
Index
Cont
Index
No content intended for this page proceed to next
Warranty
Return Policy
TÜV
Conformite
Erklärung
Page
Ireland
Customer Support Centers