Hp procurve series 2500 switches
Page
HP ProCurve Switches 2512
Management and Configuration Guide
Publication Number
Preface
Use of This Guide and Other ProCurve Switch Documentation
Preface
Page
Contents
Using a Standalone Web Browser in a PC or Unix Workstation
Tasks for Your First HP Web Browser Interface Session
Globally Assigned IP Network Addresses
Chapter Contents Overview
Viii
Web Configuring IP Authorized Managers
Web Displaying and Configuring Port Security Features
Menu Viewing and Configuring IP Authorized Managers
Operating and Troubleshooting Notes
Advanced Management Rmon and HP Extended
Rmon Support Extended Rmon
Vlan Support and the Default Vlan
Another Stack Monitoring Stack Status
Igmp Operating Features
Multimedia Traffic Control with IP Multicast Igmp
10-8
10-9
Using the Event Log To Identify Problem Sources
Daylight Savings Time on HP ProCurve Switches
Xvi
Chapter Contents
Selecting a Management Interface
Selecting a Management Interface
Overview
Understanding Management Interfaces
Selecting a Management Interface
Enables Telnet in-band access to the menu functionality
Advantages of Using the Menu Interface
Menu interface also provides access for
Advantages of Using the Menu Interface
CLI Usage
Advantages of Using the CLI
HP2512config#
HP2512
Advantages of Using the HP Web Browser Interface
Advantages of Using the HP Web Browser Interface
Advantages of Using HP TopTools for Hubs & Switches
Advantages of Using HP TopTools for Hubs & Switches
Interface
Selecting a Management Interface
Screen Structure and Navigation
Using the Menu Interface
Starting and Ending a Menu Session
Using
Configure these features
Using the Menu Interface
Menu Interface
Starting and Ending a Menu Session
Starting and Ending a Menu Session
Menu Interaction with Other Interfaces
HP2512# menu Enter
How To Start a Menu Interface Session
Password
Results
How To End a Menu Session and Exit from the Console
Main Menu with Manager Privileges
Using the Menu Interface
Main Menu Features
Main Menu Features
Using the Menu Interface
Screen Structure and Navigation
Screen Structure and Navigation
How To Navigate in the Menu Interface
TaskActions
Example Showing How To Display Help
Rebooting the Switch
Rebooting the Switch
Indication of a Configuration Change Requiring a Reboot
Reboot Switch option
Logout
Menu Features List
Menu Features List
Where To Go From Here
Option Where To Turn
Using the Menu Interface
Displaying Help for an Individual Command
Use Tab To Search for or Complete a Command Word
Conventions for Command Option Displays
CLI commands are not case-sensitive
Accessing the CLI
Using the CLI
Using the CLI
Privilege Levels at Logon
Operator Privileges
Location, such as a locked wiring closet
Privilege Level Operation
Manager Privileges
HP2512 Enable
HP2512config# vlan HP2512vlan-10#
Manager prompt
Privilege Level Hierarchy
Setup
Enable
Menu
How To Move Between Levels
Change in Levels Example of Prompt , Command, and Result
? at the Operator level produces this listing
Listing Commands and Command Options
Listing Commands Available at Any Privilege Level
Example of the Manager-Level Command Listing
Typing ? at the Manager level produces this listing
Command Option Displays
HP2512config# portTab HP2512config# port-security
Example of How To List the Options for a Specific Command
Displaying CLI Help
Example of Context-Sensitive Command-List Help
Interface CLI
Configuration Commands and the Context Configuration Modes
HP2512# interface help Invalid input interface
10. Context-Specific Commands Affecting Port Context
HP2512eth-5-8# ?
HP2512vlan-100# ?
HP2512config# vlan
HP2512vlan-100#
CLI Control and Editing
Using the HP Web Browser Interface
Tasks for Your First HP Web Browser Interface Session
HP Web Browser Interface
Agent Enabled parameter setting to No
Using Using the HP Web Browser Interface
General Features
General Features
Platform Entity and OS Version Minimum Recommended
Web Browser Interface Requirements
PCs
PCs
Using a Standalone Web Browser in a PC or Unix Workstation
Enable Java and Enable JavaScript options
Using HP TopTools for Hubs & Switches
Http
Window displayed for the selected device, as shown in figure
Example of Status Overview Screen
Tasks for Your First HP Web Browser Interface Session
Viewing the First Time Install Window
Tasks for Your First HP Web Browser Interface Session
HP Web Browser
Creating Usernames and Passwords in the Browser Interface
Device Passwords Window
String
If You Lose a Password
Using the Passwords
Using the User Names
Online Help for the HP Web Browser Interface
Server URL on
Support/Mgmt URLs Feature
Support/Mgmt URLs Feature
If Online Help Fails To Operate. Do one of the following
Support URL
Help and the Management Server URL
How To Access Web Browser Interface Online Help
Overview Window
Status Reporting Features
Status Reporting Features
Port Utilization and Status Displays
Port Utilization
10. Changing the Graph Area Scale
12. The Port Status Indicators and Legend
Port Status
Each alert has the following fields of information
Alert Log
Sorting the Alert Log Entries
Alert The specific event identification
Alert String Alert Description
Alert Types
Alert Strings and Descriptions
Viewing Detail Views of Alert Log Entries
Console interface
Status Bar
Status Indicator Key
Color Switch Status
Blue
Setting Fault Detection Policy
16. The Fault Detection Window
Using the HP Web Browser Interface
Using
Interface Access Console/Serial Link, Web
IP Addressing Access,
IP Configuration
IP Configuration
IP Configuration Features
Feature Default Menu
Just Want a Quick Start?
HP2512# setup
Remove it from the switch
IP Addressing with Multiple VLANs
IP Addressing in a Stacking Environment
From the Main Menu, Select
To Configure IP Addressing
Switch Configuration IP Configuration
Following screen
Show ip
IP Commands Used in This Section
Address Ip default-gateway Ip ttl No ip timep
Syntax show ip
HP2512config# ip ttl
Configure the Optional Timep Server
Web Configuring IP Addressing
How IP Addressing Affects Switch Operation
Click on the Configuration tab
Network
DHCP/Bootp Operation
Features Available Without an IP Address
Servers
Process immediately
Address received via Dhcp or Bootp
Reply
J2512switch
Is the IP address to be assigned to the switch or Vlan
Network Preparations for Configuring DHCP/Bootp
Company Name/Address
Globally Assigned IP Network Addresses
Country
Interface Access Features
Locked environment
Switch Configuration System Information
Menu Modifying the Interface Access
To Access the Interface Access Parameters
CLI Modifying the Interface Access
Interface Access Commands Used in This Section
Configuration will take effect
To disable web browser access
To re-enable web browser access
Two parameters
Example of Executing a Series of Console Commands
Configuring Interface
System Information
System Information Features
At last Power reset
System Information
Press E for Edit. The cursor moves to the System Name field
Menu Viewing and Configuring System Information
On configuration options for these features
Enter, then press S for Save and return to the Main Menu
System information settings
CLI Viewing and Configuring System Information
System Information Commands Used in This Section
For example, to configure the age interval to seven minutes
HP2512config# mac-age-time
HP2512config# time 1545 10/01/00
Web Configuring System Parameters
For example, to set the switch to 345 p.m. on October 1
Configure System Parameters in the Web Browser Interface
Configuring Interface
Port Trunking
Viewing port status Configuring ports 10/100TX
Viewing Port Status and Configuring Port Parameters
Port Status and ConfigurationFeatures
Status and Parameters for Each Port Type
Status or Description Parameter
Status or Description
Trunking on
Menu Viewing Port Status and Configuring Port Parameters
Using the Menu To Configure Ports
From the Main Menu, Select
Show interfaces Below Show interface config Interface
CLI Viewing Port Status and Configuring Port Parameters
Port Status and Configuration Commands
Example of a Show Interface Command Listing
Viewing Port Status and Configuring Port Parameters
Click on Port Configuration
Web Viewing Port Status and Configuring Port Parameters
Web browser interface Click on the Configuration tab
Port Trunking
Viewing port trunks Configuring a static trunk None Group
Port Trunking
Mbps Links
Switch 2512 and 2524 Port Trunk Features and Operation
T e U t i o n C P N o t e
Lacp passive
Trunk Configuration Methods
HP2512config# Int e
Trunk Types Used in Static and Dynamic Trunk Groups
See Trunk Operation Using the FEC Option on
Trunk Configuration Protocols
See Trunk Group Operation Using Lacp on
Protocol Trunking Options
General Operating Rules for Port Trunks
Monitor Port
CLI To Configure Ports on
Switch Configuration Port/Trunk Settings
Example of the Configuration for a Two-Port Trunk Group
Show trunks Below Show lacp Trunk Interface lacp
Using the CLI To View Port Trunks
Trunk Status and Configuration Commands
Example of a Show Trunk Listing Without Specifying Ports
Using the CLI To Configure a Static or Dynamic Trunk Group
Trk1 Static Dyn1 Dynamic
You can configure trunk group types as follows
Trunk Type Trunk Group Membership
Yes Trunk
HP2512config# interface 5-6 lacp active
Web Viewing Existing Port Trunk Groups
HP2512config# no interface 1 lacp
HP2512config# interface 1 lacp passive
Click on Port Status
Lacp trunk status include
Trunk Group Operation Using Lacp
Trunk group
Lacp Trunk Types
HP2512 show lacp
Default Port Operation
Particular switch, execute the following command in the CLI
Lacp Port Status Data
Disabled The port cannot carry traffic
Lacp Notes and Restrictions
Trunk Group Operation Using the Trunk Option
Trunk Operation Using the FEC Option
How the Switch Lists Trunk Data
Outbound Traffic Distribution Across Trunked Links
11. Example of Port-Trunked Network
Node a Node W Node B Node C Node Y Node D Node Z
Through Traffic Control Optimizing Port Usage
CLI Port Security Command Options and Operation
Using Passwords, Port
Chapter Contents
Overview
Level Actions Permitted
Using Password Security
Password Features Default Menu
Menu Setting Manager and Operator passwords
To set a new password
Continue Deletion of password protection? No
Password below
CLI Setting Manager and Operator Passwords
Password Commands Used in This Section
Syntax password manager operator no password
Click on the Security tab
Web Configuring User Names and Passwords
Click on Device Passwords
Basic Operation
Configuring and Monitoring Port Security
Configuring Port Security Disabled
Cast traffic
Configuring and Monitoring Port Security
Blocking Unauthorized Traffic
Planning Port Security
Trunk Group Exclusion
Configuring and Monitoring Port Security
Commands
CLI Port Security Command Options and Operation
Port Security Commands Used in This Section
Acquires and maintains authorized addresses
Port Security Parameters
Ethernet port-list
Clear-intrusion-flag
Address-limit integer
Mac-address mac-addr
CLI Displaying Current Port Security Settings
Using the CLI To Display Port Security Settings
CLI Configuring Port Security
Using Passwords, Port Security, and Authorized IP
HP2512config# port-security 1 mac-address 0c0090-456456
U t i o n T e
Web Displaying and Configuring Port Security Features
Click on Port Security
Reading Intrusion Alerts and Resetting Alert Flags
How the Intrusion Log Operates
Keeping the Intrusion Log Current by Resetting Alert Flags
Example of Multiple Intrusion Log Entries for the Same Port
Type I Intrusion log to display the Intrusion Log
Status and Counters Port Status
Configuring and Monitoring Port Security
Clear Intrusion flags on all ports
List Intrusion Log content
List Intrusion Alert status
Using the Event Log To Find Intrusion Alerts
Event Log lists port security intrusions as
Operating Notes for Port Security
Configuring and Monitoring Port Security
Using IP Authorized Managers
Authorized IP Manager Features
Defining Authorized Management Stations
Access Levels
Using IP Authorized Managers
Overview of IP Mask Operation
Masks on
From the console Main Menu, select
Menu Viewing and Configuring IP Authorized Managers
Switch Configuration IP Authorized Managers
Authorized IP Managers Commands Used in This Section
CLI Viewing and Configuring Authorized IP Managers
Listing the Switch’s Current Authorized IP Managers
IP Mask
Configuring IP Authorized Managers for the Switch
HP2512config# ip authorized-managers
Building IP Masks
Web Configuring IP Authorized Managers
Configuring One Station Per Authorized Manager IP Entry
Address of the authorized manager you want to delete
Manager IP
Analysis of IP Mask for Single-Station Entries
Authorized 227 125
Port IP
Analysis of IP Mask for Multiple-Station Entries
Results
Operating and Troubleshooting Notes
Additional Examples for Authorizing Multiple Stations
Authorized
Security, and Authorized IP Using Passwords, Port
Configuring for Network Management Applications
Monitoring and Managing the Switch
Managing Switch
Monitoring Configuring for Network Management Applications
Snmp Management Features
Snmp Management Features
Configuring for Snmp Access to the Switch
Configuring for Snmp Access to Switch
Switch Configuration Snmp Community Names
HP Entity MIB entity.mib
To Restricted
Snmp Communities
Snmp Community Features
Write access for the public community to Restricted
To View, Edit, or Add Snmp Communities
Snmp Communities Screen Default Values
Snmp Add or Edit Screen
Listing Current Community Names and Values
CLI Viewing and Configuring Community Names
Community Name Commands Used in This Section
Community community-str
HP2512# show snmp-server public
Configuring Identity Information
Configuring Community Names and Values
Regardless of the trap receiver configuration
Trap Receivers and Authentication Traps
Trap Features
Opotions are used with the snmp-server host command
Trap Receiver Commands Used in This Section
CLI Configuring and Displaying Trap Receivers
Using the CLI To List Current Snmp Trap Receivers
Syntax show snmp-server
Using the CLI To Enable Authentication Traps
Using the CLI To Enable Authentication Traps
Configuring Trap Receivers
Advanced Management Rmon and HP Extended Rmon Support
Extended Rmon
Advanced Management Rmon and HP Extended Rmon Support
Monitoring
Using the CLI To View Stack Status and Configure Stacking
Features
Configuring Advanced Features
Configuring Advanced Features
108
103
105
109
Overview
HP ProCurve Stack Management
Stacking Features Default Menu
Configure stacking
Reduce the number of IP addresses needed in your network
Which Devices Support Stacking?
HP ProCurve Switch 8000M
HP ProCurve Switch 4000M
Stacking Definitions
Components of HP ProCurve Stack Management
General Stacking Operation
Network Backbone
Operating Rules for Stacking
General Rules
Specific Rules
IP Addr Optional
Stack Name N/A
Overview of Configuring and Bringing Up a Stack
Stacking Configuration Guide
No Manager password Or fewer stack members at the moment
Use of System Name to Help Identify Individual Switches
General Steps for Creating a Stack
Configuring Advanced Features
Default Stacking Menu
Default Stack Configuration Screen
Using the Menu To Manage a Candidate Switch
Candidate Commander, Member, or Disabled
Candidate Configuration Options in the Menu Interface
Parameter Default Setting Other Settings Stack State
Seconds Range 1 to 300 seconds
Using the Commander To Manage The Stack
You will then see the Stack Management screen
Using the Commander’s Menu To Manually Add a Candidate to a
To add a Member, start at the Main Menu and select
Stacking Stack Management
10. Example of Candidate List in Stack Management Screen
Stacking
Stacking Status All
You will then see the Stacking Status All screen
Member MAC Addresses
Commander
Member listed
14. Example of Selecting a Member for Removal from the Stack
You will then see the Stack Access screen
Stacking Stack Access
Press Return
From the Main Menu of the switch you want to move, select
Stacking Status All Features
Stacking
Monitoring Stack Status
Stack Configuration
Screen Name Commander Member Candidate
Stack Status Environments
Stacking Stacking Status All
You will then see the Commander’s Stacking Status screen
Stacking Stacking Status This Switch
19. Example of the Commander’s Stacking Status Screen
You will then see the Member’s Stacking Status screen
Configuring Advanced
You will then see the Candidate’s Stacking Status screen
CLI Commands for Configuring Stacking on a Switch
Interface
Used In Commander Only
CLI Command Operation No stack member
Manager password
Commander’s CLI
Using the CLI To View Stack Status
Viewing the Status of Candidates the Commander Has Detected
Features Configuring Advanced
Viewing the Status of the Commander and Current Members
Using the CLI To Configure a Commander Switch
Commander Discovered
26. Example of the Commander’s Show Stack Screen with Only
Adding to a Stack or Moving Switches Between Stacks
Using the Commander’s CLI To Manually Add a Candidate to
28. Example of How To Determine Available Switch Numbers SNs
HP 2512config# stack auto-join
HP2512config# stack member 2 mac-address 0060b0-dfla00
HP2512config# no stack auto-join
Candidate
Using the Destination Commander CLI To Pull a Member from
31. Example of Pushing a Candidate Into a Stack
HP2524config# stack member 1 mac-address 0060b0-df1a00
32. Example of Stack Listing with Two Stacks in the Subnet
Member
Using the CLI To Remove a Member from a Stack
Access to the Commander
Or the Member
HP2512config# no stack member 3 mac-address 0030c1-7fc700
Using the Member’s CLI To Remove the Member from a Stack
North Seaconfig# no stack join 0030c1-7fec40
HP2512config# telnet
Member Switch
Snmp Management Station Access to Members Via the Commander
Commander Switch
Snmp Community Operation in a Stack
Snmpget MIB variable 10.31.29.100 blue@sw2
Using the CLI To Disable or Re-Enable Stacking
Transmission Interval
Web Viewing and Configuring Stacking
38. Example of the Web Browser Interface for a Commander
Message Condition Action or Remedy
Status Messages
Stacking screens and listings display these status messages
Port-Based Virtual LANs Static VLANs
Vlan Features Default Menu
Disabled See Gvrp on VLANs
Address would normally belong to the same Vlan
39. Example of Routing Between VLANs via an External Router
40. Example of Overlapping VLANs Using the Same Server
Which Vlan Is Primary?
Overview of Using VLANs
Vlan Support and the Default Vlan
Per-Port Static Vlan Configuration Options
Auto
Tagged
Untagged
Forbid
General Steps for Using VLANs
Switch Configuration Vlan Menu Vlan Support
Menu Configuring Vlan Parameters
To Change Vlan Support Settings
You will then see the following screen
To the Vlan Menu screen
Space bar to select from the existing options
Gvrp on
802.1Q Vlan ID Name
Switch Configuration Vlan Menu Vlan Names
Adding or Editing Vlan Names
Switch Configuration Vlan Menu Vlan Port Assignment
Adding or Changing a Vlan Port Assignment
48. Example of Vlan Port Assignment Screen
Untagged, or Forbid
CLI Configuring Vlan Parameters
49. Example of Vlan Assignments for Specific Ports
Static-vlan vlan-id 9-67 Available if Gvrp enabled
Vlan Commands Used in this Section
9-67 Available if Gvrp enabled
No tagged port-list No untagged port-list No forbid
51. Example of Show Vlan for a Specific Static Vlan
For example, to make Vlan 22 the primary Vlan
For example, to reconfigure the switch to allow 10 VLANs
HP2512config# primary-vlan
That static Vlan
HP2512vlan-100# vlan defaultvlan
Creating a New Static Vlan Changing the Vlan Context Level
For example, to create a new static Vlan with a VID
HP2512config# static-vlan
At the Vlan 100 context level, use
Web Viewing and Configuring Vlan Parameters
HP2512config# no vlan 100 tagged
HP2512vlan-100# no tagged
Click on Vlan Configuration Click on Add/Remove VLANs
Vlan Tagging Information
54. Example of Tagged and Untagged Vlan Port Assignments
For the Red VID in switch Y
Untagged Tagged
Switch Switch Y
Port Red Vlan Green Vlan
IP Interfaces
Effect of VLANs on Other Switch Features
Spanning Tree Protocol Operation with VLANs
To summarize
Port Monitoring
Vlan MAC Addresses
Port Trunks
Supported
Vlan Restrictions
IP Host-Only
Vlan to another Vlan
Symptoms of Duplicate MAC Addresses in Vlan Environments
View Gvrp configuration
On a GVRP-enabled switch
General Operation
Vlan Advertising and Joining on
Switch E Gvrp On
Switch D Gvrp On
Switch C Gvrp On
To allow tagged packets to pass through
Per-Port Options for Handling Gvrp Unknown VLANs
Options for Handling Unknown Vlan Advertisements
Mode
Controlling Vlan Behavior on Ports with Static VLANs
Per-Port Static Vlan Options Gvrp Configuration
Per-Port Options for Dynamic Vlan Advertising Joining
Tagged or Untagged2 Auto2 Forbid2
Dynamically joining other VLANs
Gvrp and Vlan Access Control
Port-Leave From a Dynamic Vlan
To generate advertisements
Planning for Gvrp Operation
Configuring Gvrp On a Switch
Menu Viewing and Configuring Gvrp
60. The Vlan Support Screen Default Configuration
Show gvrp Below Gvrp Unknown -vlans
CLI Viewing and Configuring Gvrp
Gvrp Commands Used in This Section
HP2512config# interface 1-2 unknown-vlans block
HP2512config# gvrp
HP2512config# no gvrp
64. Example of Listing Showing Dynamic VLANs
VLAN-222 VLAN-33
Gvrp Operating Notes
Web Viewing and Configuring Gvrp
HP2512config# static
Configuring Advanced
Multimedia Traffic Control with IP Multicast Igmp
Igmp Features Default Menu
View igmp configuration
Multimedia Traffic Control with IP Multicast Igmp
Address Information screen
Igmp Operating Features
IGMP. Refer to IP Configuration on
Igmp Commands Used in This Section
CLI Configuring and Displaying Igmp
Indicating whether querier functionality is enabled
How Igmp Operates on
Igmp configuration for a
Igmp configuration for all
VLANs on the switch
Including per-port data
HP2512vlan-1# ip igmp
HP2512config# vlan 1 ip igmp
HP2512config# no vlan 1 ip igmp
Configuring Per-Port Igmp Packet Control. Use this command
Web Enabling or Disabling Igmp
How Igmp Operates
Role of the Switch
67. The Advantage of Using Igmp
68. Isolating IP Multicast Traffic in a Network
Interaction with Multicast Traffic/Security Filters
Be flooded instead of filtered by the switch
Number of IP Multicast Addresses Allowed
Per Vlan in which it is used
Cast storm that can bring down the network
STP Features Default Menu
Spanning Tree Protocol STP
Menu Configuring STP
Switch Configuration Spanning Tree Operation
69. Example of the STP Configuration Screen
Actions line
Default configuration, STP appears as shown here
CLI Configuring STP
Default
STP Commands Used in This Section
HP2512config# spanning tree
10.General STP Operating Parameters
11.Per-Port STP Parameters
HP2512config# spanning tree maximum-age 30 hello-time
Default See -11, above
107
Web Enabling or Disabling STP
How STP Operates
STP Fast Mode
71. Example of Redundant Paths Between Two Nodes
STP Operation with 802.1Q VLANs
To Configure Fast Mode for a Switch Port
HP2512config# spanning-tree ethernet 1-3,5 mode fast
Ing network loops
72. Example of Using a Trunked Link with STP and VLANs
112
10-1
Switch Operation
Internet Group Management Protocol Igmp Status
Analyzing Operation
Ing. See Diagnostic Tools on
Monitoring Switch Monitoring and Analyzing Switch Operation
10-2
10-3
Window under the Configuration tab
Status and Counters Data
Interface Purpose
Menu Access To Status and Counters
Status and Counters
General System Information
Menu Access
CLI Access
10-5
10-6
Switch Management Address Information
Monitoring Switch
Port Status
Web Access
Status and Counters . . .3. Port Status Switch Operation
Menu Displaying Port Status
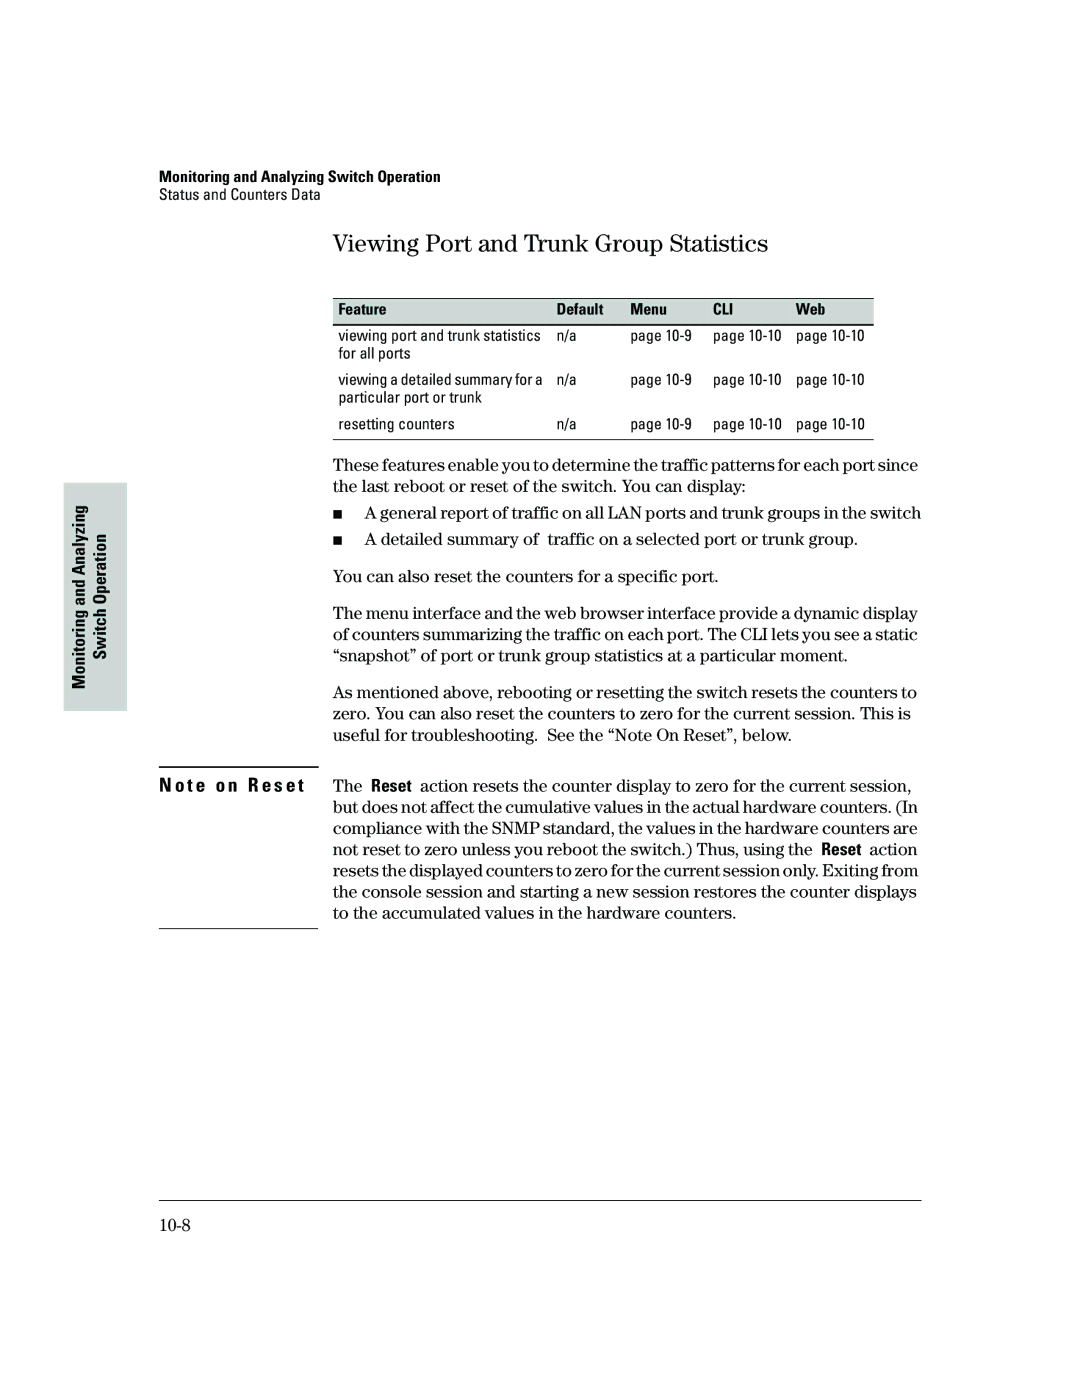
For all ports
Particular port or trunk Resetting counters
Viewing Port and Trunk Group Statistics
Status and Counters Port Counters
Menu Access to Port and Trunk Statistics
To access this screen from the Main Menu, select
Mand provides traffic details for the port you specify
CLI Access To Port and Trunk Group Statistics
Web Browser Access To View Port and Trunk Group Statistics
Click on Port Counters
Viewing the Switch’s MAC Address Tables
10-11
To page through the listing, use Next page and Prev
Menu Access to the MAC Address Views and Searches
Status and Counters Address Table
Enter MAC address
Example of Menu Indicating Located MAC Address
Listing MAC Addresses for a Specific Port
CLI Access for MAC Address Views and Searches
To Find the Port On Which the Switch Learned a Specific MAC
Status and Counters Spanning Tree Information
Menu Access to STP Data
Spanning Tree Protocol STP Information
10-16
CLI Access to STP Data
HP2512 show spanning-tree
Show Command Output
10-17
Ports
Switch uses the CLI to display the following Vlan status
Vlan Information
10-18
10-19
Listing the Vlan ID VID and Status for Specific Ports
Listing Individual Vlan Status
Web Browser Interface Status Information
10-20
10-21
Port Monitoring Features
Port Monitoring Features Default Menu
Menu Configuring Port Monitoring
Switch Configuration Network Monitoring Port
Monitoring and Analyzing
To monitor individual ports
To monitor all ports in a Vlan
CLI Configuring Port Monitoring
Port Monitoring Commands Used in This Section
For example, to assign port 12 as the monitoring port
HP2512config# mirror-port
HP2512config# no mirror-port
To turn off port monitoring
Click on Monitor Port
Web Configuring Port Monitoring
To enable port monitoring Click on the Configuration tab
Click on Apply Changes
11-1
Troubleshooting
Menu Entering and Navigating in the Event Log
Troubleshooting
11-3
Troubleshooting Approaches
Troubleshooting Approaches
Browser or Console Access Problems
Browser or Console Access Problems
Cannot access the web browser interface
11-5
Ip Invalid ARP source IP address on IP address
General Problems
Unusual Network Activity
11-6
IGMP-Related Problems
11-7
Timep or Gateway Problems
Problems Related to Spanning-Tree Protocol STP
Stacking-Related Problems
Switch Cannot Find the Timep Server or the Configured
Within Same Outside Tagged Vlan
VLAN-Related Problems
11-9
Tagged Monitor
11-10
Date Time System Module
Using the Event Log To Identify Problem Sources
08/05/98 105232 Ports Port 1 enabled
11-11
From the Main Menu, select Event Log
Menu Entering and Navigating in the Event Log
Event Log System Modules
11-12
Event Log Control Keys
HP2512 show logging -a system
Diagnostic Tools
Diagnostic Tools
Diagnostic Features
Ping and Link Tests
Web Executing Ping or Link Tests
11-15
CLI Ping or Link Tests
To halt a ping test before it concludes, press Ctrl C 11-16
14.Example of Link Tests Troubleshooting
11-17
Web Viewing the Configuration File
Displaying the Configuration File
CLI Viewing the Configuration File
Click on Configuration Report
Displays the current command
Currently running on the switch
Displays the switch shutdown
Toggles the paging mode for
Clear/Reset Resetting to the Factory-Default Configuration
Restoring the Factory-Default Configuration
CLI Resetting to the Factory-Default Configuration
Appendix Contents
Model. See Transferring Switch Configurations on page A-10
Downloading an Operating System OS
Using Tftp To Download the OS File from a Server
Downloading an Operating System OS
Menu Tftp Download from a Server
Console Main Menu, select Download OS to display this screen
Validating and Writing System Software to Flash
CLI Tftp Download from a Server
Check the Firmware revision line
Menu Switch-to-Switch Download
Using the SNMP-Based Software Update Utility
Series 2500 Switch-to-Switch Download
Menu Xmodem Download
Using Xmodem to Download the OS File From a PC
CLI Switch-To-Switch Download
Syntax
CLI Xmodem Download from a PC or Unix Workstation
HP2512 show system
HP2512# show log tftp
Troubleshooting Tftp Downloads
Troubleshooting Tftp Downloads
Transfer Features Default Menu
Transferring Switch Configurations
Tftp Retrieving a Configuration from a Remote Host
Session in which the download was attempted
Tftp Copying a Configuration to a Remote Host
Syntax copy xmodem startup-config pc unix
Appendix B Contents
MAC Address Management
MAC Address Management
MAC Address Viewing Methods Feature Default Menu
Determining MAC Addresses
Determining MAC Addresses
Any additional VLANs configured on the switch
Menu Viewing the Switch’s MAC Addresses
Base switch default Vlan VID =
Configured on the Switch
CLI Viewing the Port and Vlan MAC Addresses
HP2512# walkmib ifPhysAddress
Switch Memory and Configuration
Switch Memory and Configuration
Overview of Configuration File Management
Startup-Config File
HP2512config# write memory
Any of the following actions reboots the switch
HP2512config# interface ethernet 5 disable
Overview of Configuration File Management
Using the CLI To Implement Configuration Changes
Using the CLI To Implement Configuration Changes
HP2512config# interface e 5 speed-duplex auto-10
Syntax write memory
Do you want to save current configuration y/n?
With the factory-default startup configuration
Changes on page C-9
Syntax erase startup-config
Changes
Memory in the CLI before rebooting the switch
Using Save and Cancel in the Menu Interface
Cancelled
Rebooting from the Menu Interface
73.The Reboot Switch Option in the Main Menu
Config file and the startup-config file
Using the Web Browser Interface To Implement
Configuration Changes
Alaska
2524 2400M 224M Switches 2424M
Daylight Savings Time on HP ProCurve Switches
Canada and Continental US
Southern Hemisphere
ProCurve Switches
Middle Europe and Portugal
Western Europe
Daylight Savings Time on HP ProCurve Switches
Page
Index
Index
See FEC
Garp
Lacp
See Igmp
See Vlan
See MIB
See also IP
VID
Xmodem OS download … A-7 XNS …