257
Complex Samples Cox Regression
Log-Minus-Log Plot
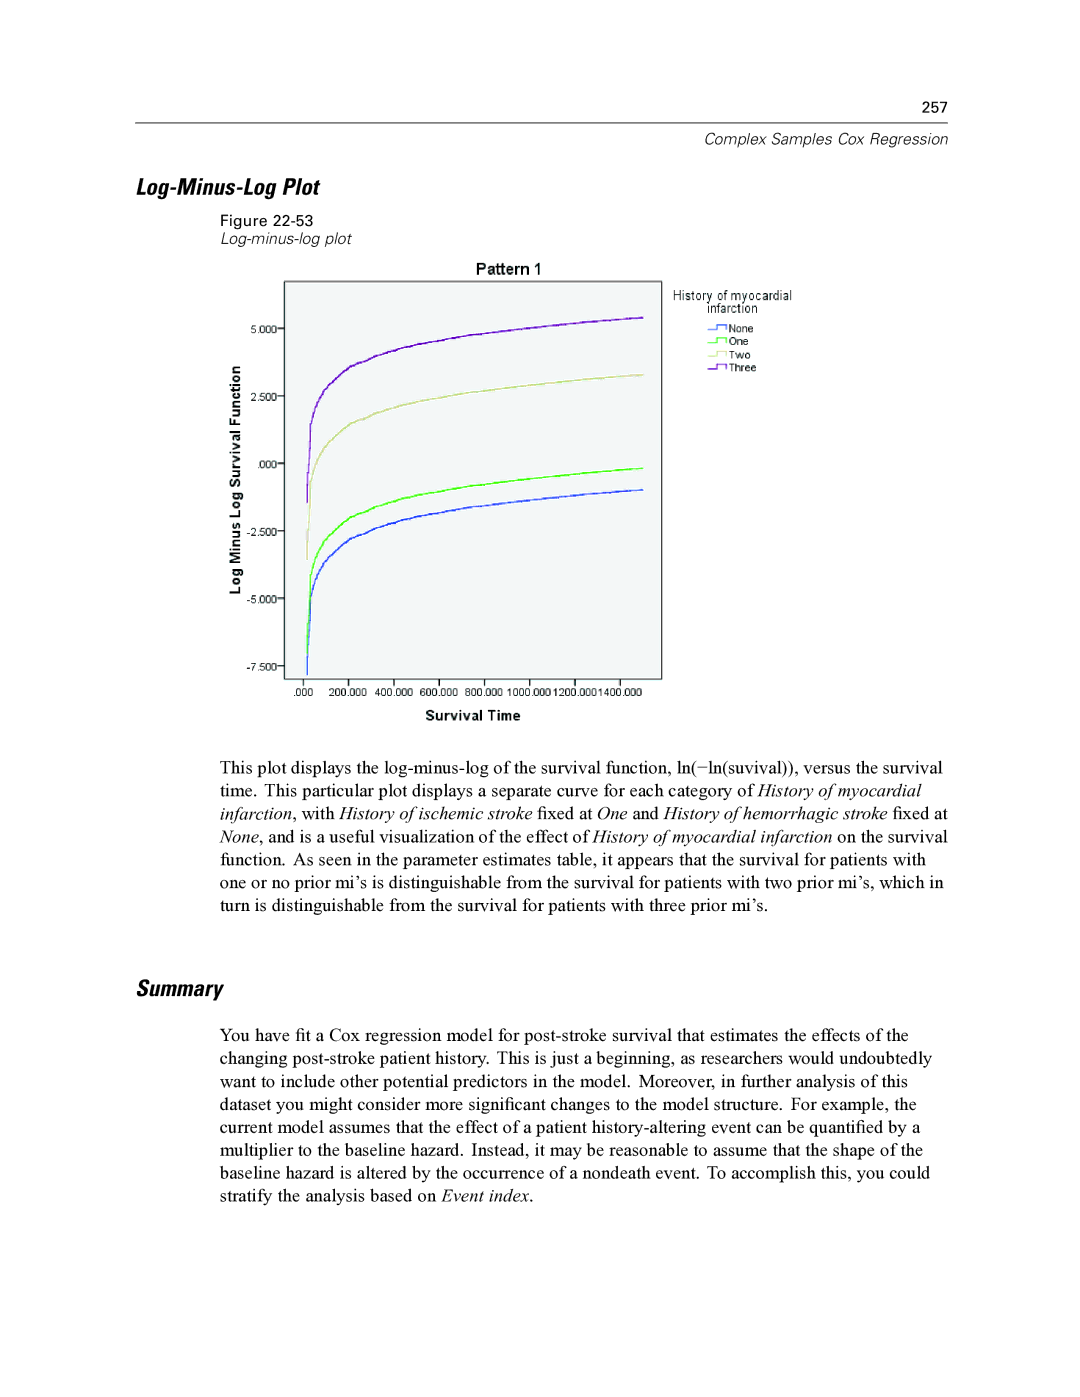
Figure 22-53
Log-minus-log plot
This plot displays the log-minus-log of the survival function, ln(−ln(suvival)), versus the survival time. This particular plot displays a separate curve for each category of History of myocardial infarction, with History of ischemic stroke fixed at One and History of hemorrhagic stroke fixed at None, and is a useful visualization of the effect of History of myocardial infarction on the survival function. As seen in the parameter estimates table, it appears that the survival for patients with one or no prior mi’s is distinguishable from the survival for patients with two prior mi’s, which in turn is distinguishable from the survival for patients with three prior mi’s.
Summary
You have fit a Cox regression model for post-stroke survival that estimates the effects of the changing post-stroke patient history. This is just a beginning, as researchers would undoubtedly want to include other potential predictors in the model. Moreover, in further analysis of this dataset you might consider more significant changes to the model structure. For example, the current model assumes that the effect of a patient history-altering event can be quantified by a multiplier to the baseline hazard. Instead, it may be reasonable to assume that the shape of the baseline hazard is altered by the occurrence of a nondeath event. To accomplish this, you could stratify the analysis based on Event index.