174
Chapter 18
Ratios
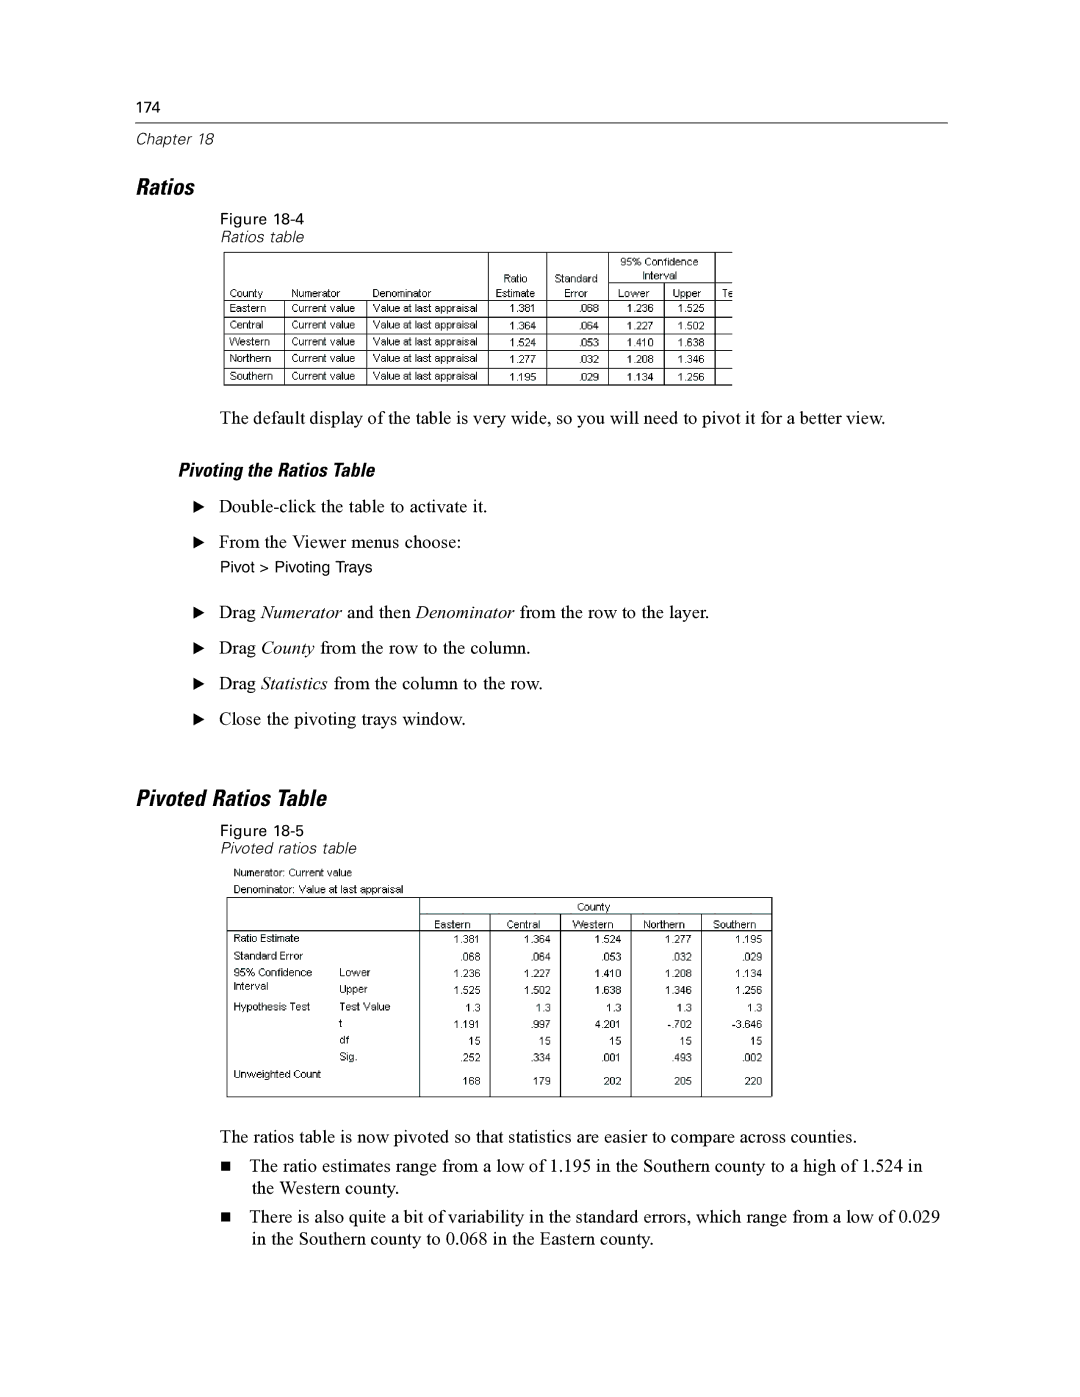
Figure
Ratios table
The default display of the table is very wide, so you will need to pivot it for a better view.
Pivoting the Ratios Table
E
EFrom the Viewer menus choose:
Pivot > Pivoting Trays
EDrag Numerator and then Denominator from the row to the layer.
EDrag County from the row to the column.
EDrag Statistics from the column to the row.
EClose the pivoting trays window.
Pivoted Ratios Table
Figure
Pivoted ratios table
The ratios table is now pivoted so that statistics are easier to compare across counties.
The ratio estimates range from a low of 1.195 in the Southern county to a high of 1.524 in the Western county.
There is also quite a bit of variability in the standard errors, which range from a low of 0.029 in the Southern county to 0.068 in the Eastern county.