190
Chapter 20
Figure
Logistic Regression Odds Ratios dialog box
EChoose to create odds ratios for the factor ed and the covariates employ and debtinc.
EClick Continue.
EClick OK in the Logistic Regression dialog box.
Pseudo R-Squares
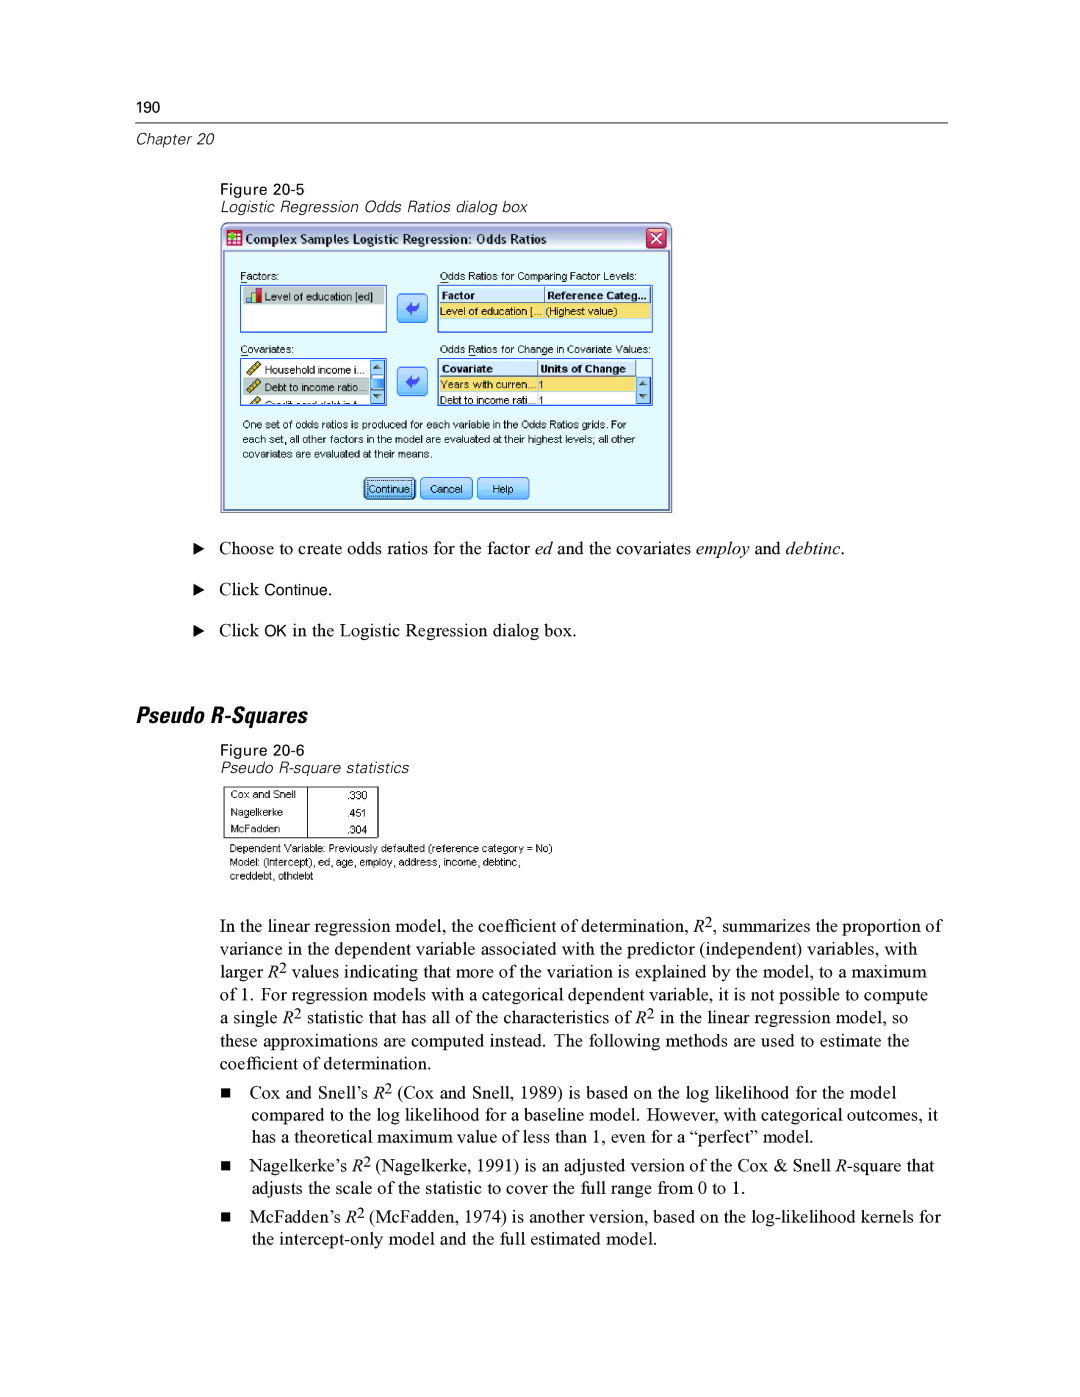
Figure
Pseudo
In the linear regression model, the coefficient of determination, R2, summarizes the proportion of variance in the dependent variable associated with the predictor (independent) variables, with larger R2 values indicating that more of the variation is explained by the model, to a maximum of 1. For regression models with a categorical dependent variable, it is not possible to compute a single R2 statistic that has all of the characteristics of R2 in the linear regression model, so these approximations are computed instead. The following methods are used to estimate the coefficient of determination.
Cox and Snell’s R2 (Cox and Snell, 1989) is based on the log likelihood for the model compared to the log likelihood for a baseline model. However, with categorical outcomes, it has a theoretical maximum value of less than 1, even for a “perfect” model.
Nagelkerke’s R2 (Nagelkerke, 1991) is an adjusted version of the Cox & Snell
McFadden’s R2 (McFadden, 1974) is another version, based on the