168
Chapter 17
Figure
Crosstabs Statistics dialog box
EDeselect Population size and select Row percent in the Cells group.
ESelect Odds ratio and Relative risk in the Summaries for
EClick Continue.
EClick OK in the Complex Samples Crosstabs dialog box.
These selections produce a crosstabulation table and risk estimate for Newspaper subscription by Response. Separate tables with results split by Income category in thousands are also created.
Crosstabulation
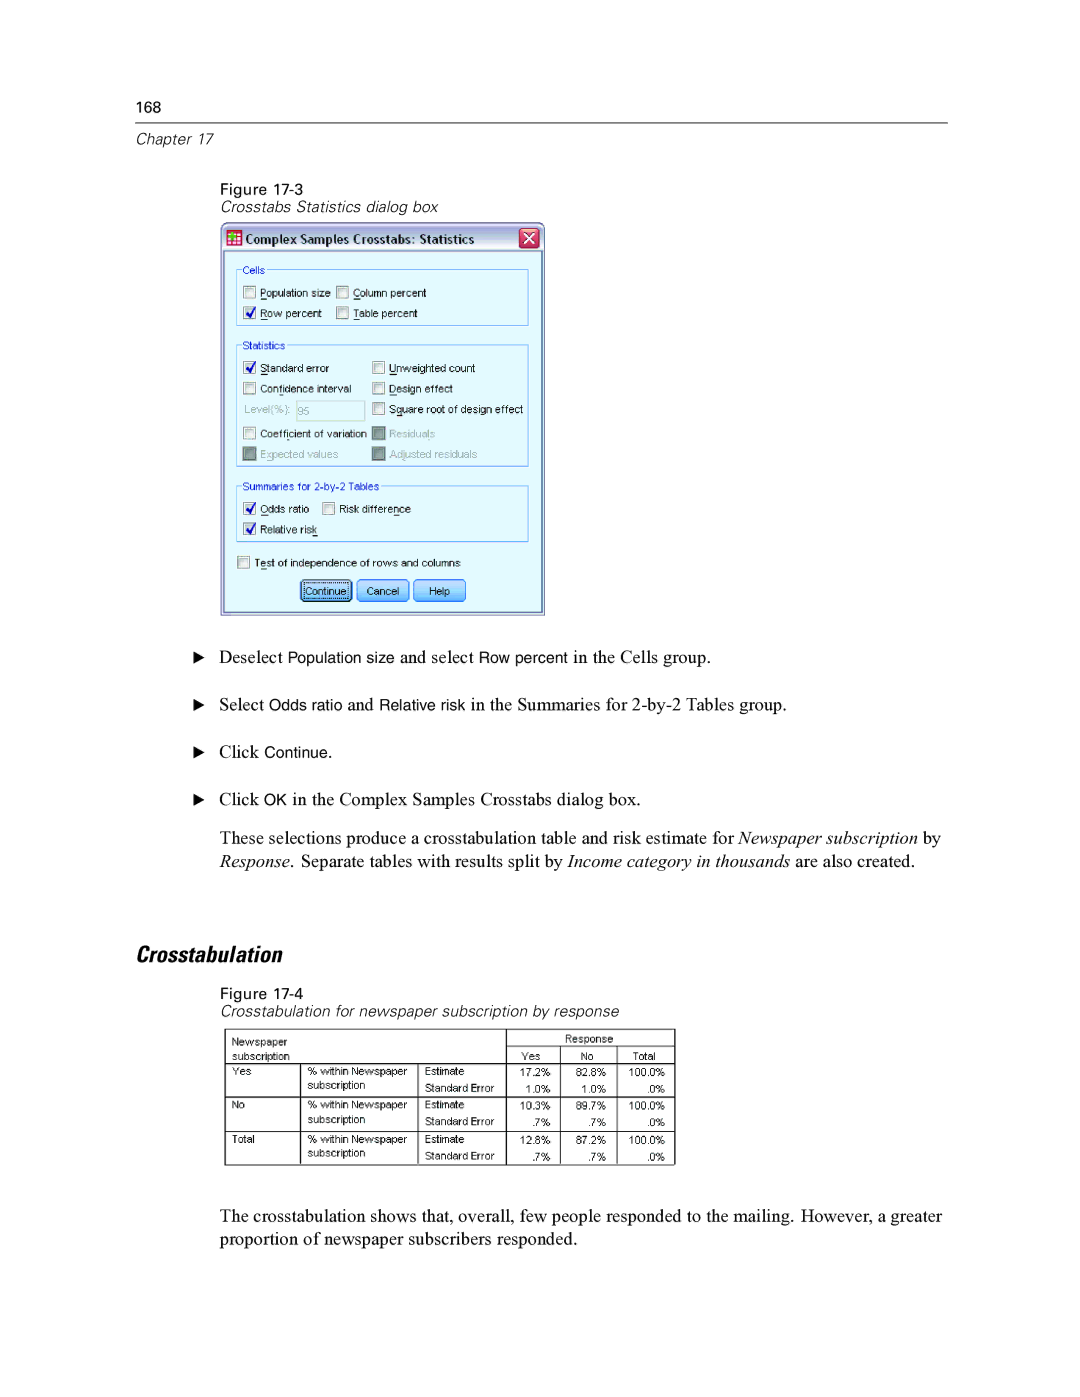
Figure
Crosstabulation for newspaper subscription by response
The crosstabulation shows that, overall, few people responded to the mailing. However, a greater proportion of newspaper subscribers responded.