181
Complex Samples General Linear Model
ESelect a Simple contrast and 3 Self and family as the reference category for shopfor. Note that, once selected, the category appears as “3” in the dialog box.
ESelect a Simple contrast and 1 No as the reference category for usecoup.
EClick Continue.
EClick OK in the General Linear Model dialog box.
Model Summary
Figure
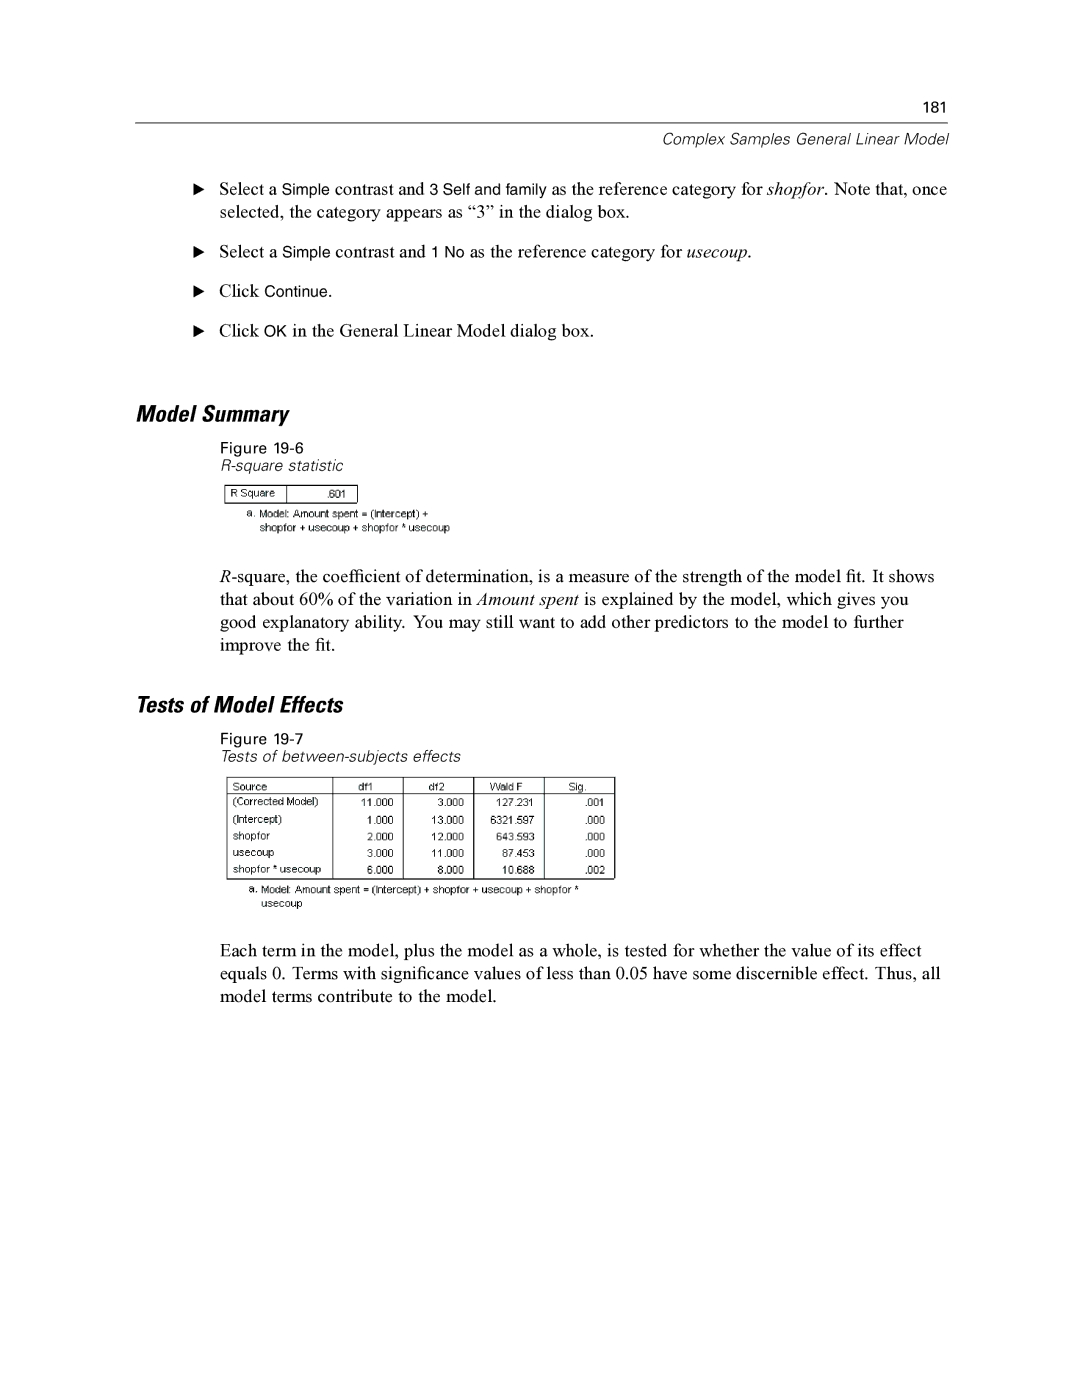
Tests of Model Effects
Figure
Tests of
Each term in the model, plus the model as a whole, is tested for whether the value of its effect equals 0. Terms with significance values of less than 0.05 have some discernible effect. Thus, all model terms contribute to the model.