35
Complex Samples Descriptives
Summaries. This group allows you to request estimates of the means and sums of the measure variables. Additionally, you can request t tests of the estimates against a specified value.
Statistics. This group produces statistics associated with the mean or sum.
Standard error. The standard error of the estimate.
Confidence interval. A confidence interval for the estimate, using the specified level.
Coefficient of variation. The ratio of the standard error of the estimate to the estimate.
Unweighted count. The number of units used to compute the estimate.
Population size. The estimated number of units in the population.
Design effect. The ratio of the variance of the estimate to the variance obtained by assuming that the sample is a simple random sample. This is a measure of the effect of specifying a complex design, where values further from 1 indicate greater effects.
Square root of design effect. This is a measure of the effect of specifying a complex design, where values further from 1 indicate greater effects.
Complex Samples Descriptives Missing Values
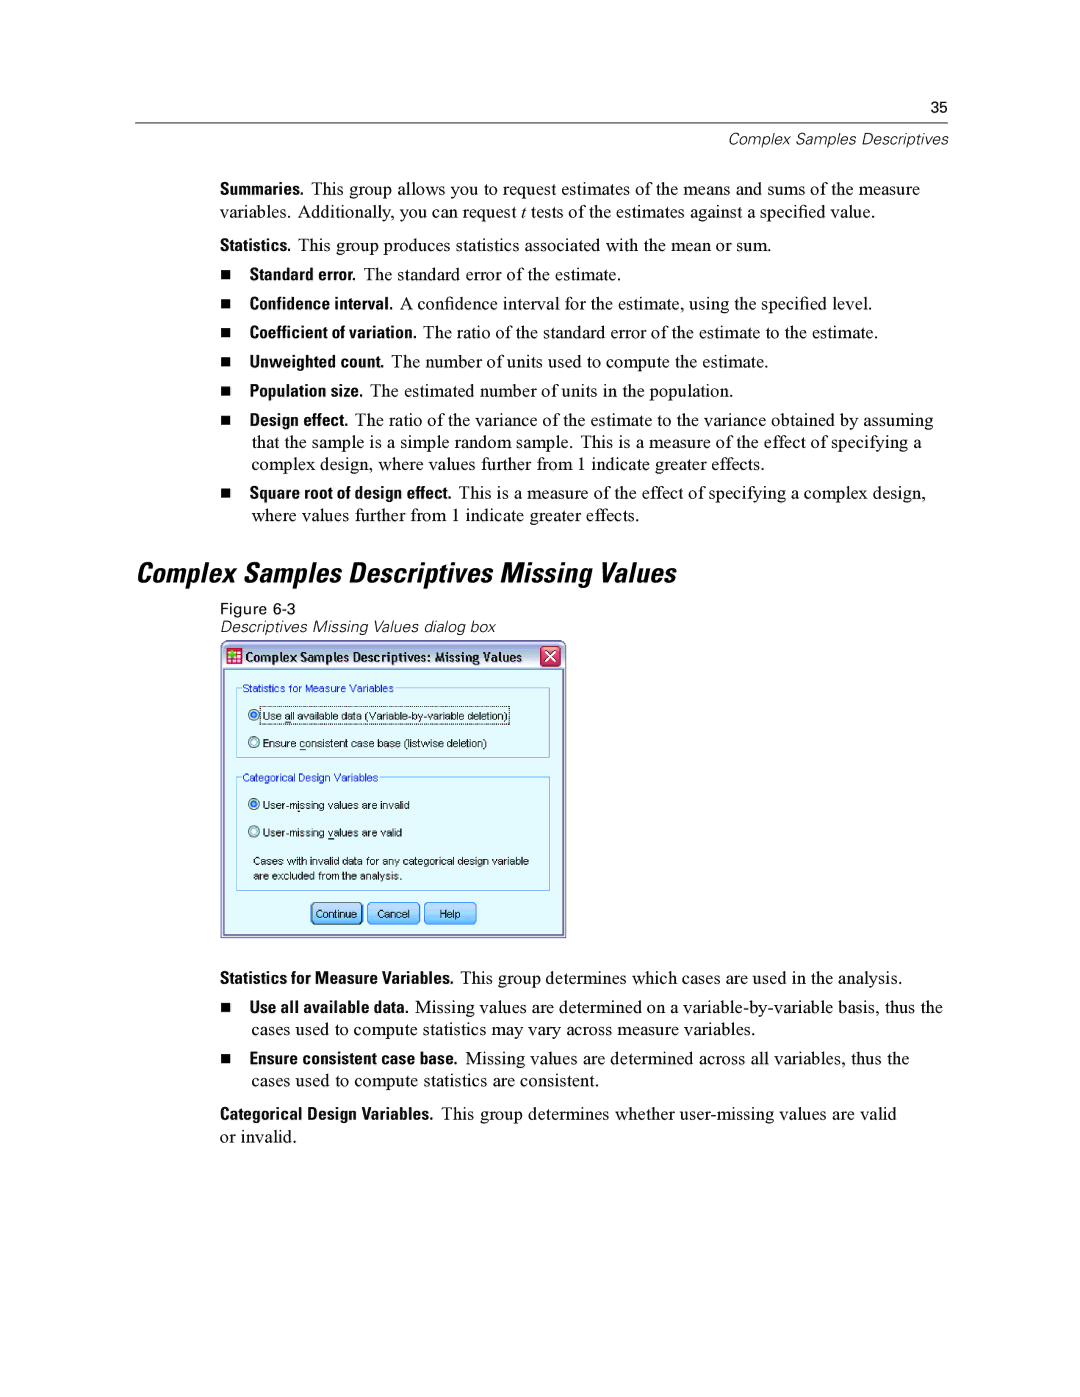
Figure
Descriptives Missing Values dialog box
Statistics for Measure Variables. This group determines which cases are used in the analysis.
Use all available data. Missing values are determined on a
Ensure consistent case base. Missing values are determined across all variables, thus the cases used to compute statistics are consistent.
Categorical Design Variables. This group determines whether
