January/April/October
Toolcat Mkttools GET AS4ADV36 Package
Table of Contents
107
Performance Observations and Tips
117
System Application Server Instance 119
157
10.2 DB2 for i5/OS access with Odbc 155
158
11.1
196
Supported Backup Device Rates 243
199
200
IPL Performance
19.6 User Pool Faulting Guidelines 310 19.7
17.7 File Level Backup Performance 292
284
285
334
Switchable IASP’s 327 Geographic Mirroring 329
335
What the Estimator is Not 335
Disclaimer Notice
Special Notices
Ipds
Purpose of this Document
Introduction
Page
Interactive Indicators and Metrics
ISeries and AS/400 Risc Server Model Performance Behavior
Overview
3 V5R3
Disclaimer and Remaining Sections
4 V5R2 and V5R1
Server Model Behavior V4R5 V5R2
Page
100
Server Model Differences
Custom Server Model
Performance Highlights of Model 7xx Servers
Model 7xx and 9/98 Model
Performance Highlights of Model 170 Servers
Additional Server Considerations
Performance Highlights of Custom Server Models
Example
Interactive Utilization
Server Dynamic Tuning SDT
Page
Affects of Server Dynamic Tuning
Managing Interactive Capacity
Interactive/Server characteristics in the real world
Is Interactive really Interactive?
Page
Migration from Traditional Models
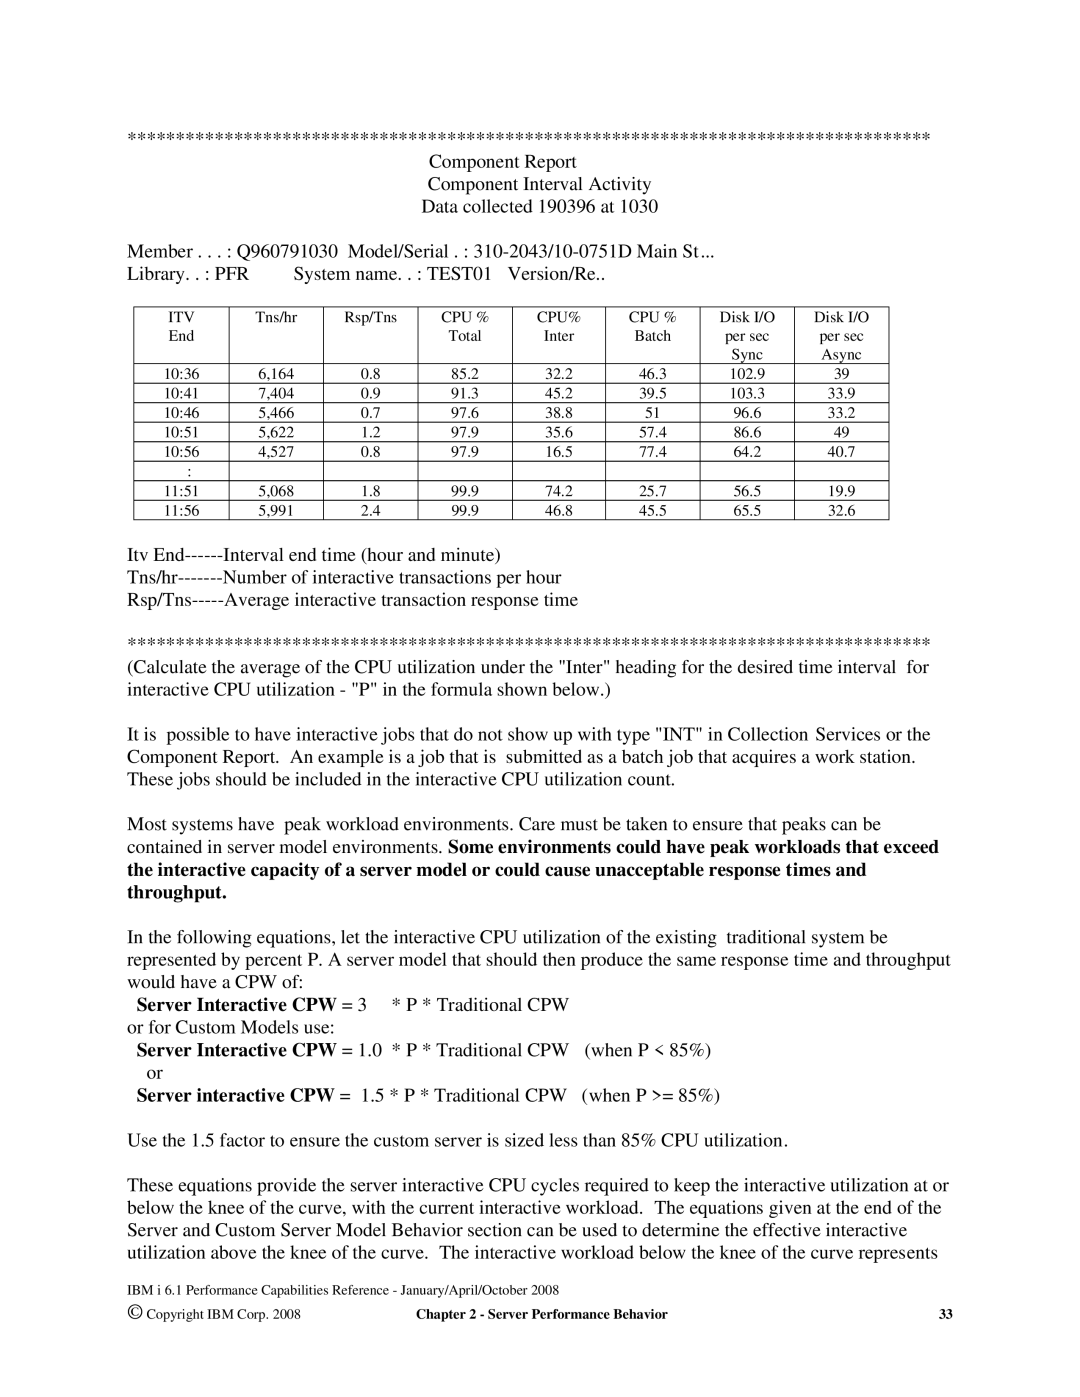
Number of interactive transactions per hour
Interval end time hour and minute
Upgrade Considerations for Interactive Capacity
13.2 V5R1 DSD Performance Behavior
Domino-Complementary Processing
V5R1 Non-Domino Processing
Interactive Processing
Running Linux on a Dedicated Server
Logical Partitioning on a Dedicated Server
Page
Effect of CPU Speed on Batch
Batch Performance
Effect of Dasd Type on Batch
Batch Workload Description
Expert Cache
Tuning Parameters for Batch
Job Priority
Dynamic Priority Scheduling
Page
DB2 for i5/OS Performance
New for i5/OS V6R1
I5/OS V6R1 SQE Query Coverage
Query Attribute POWER5 Processor POWER6 Processor
Records Inserted/Selected
DB2 i5/OS V5R4 Highlights
I5/OS V5R4 SQE Query Coverage
I5/OS V5R3 Highlights
I5/OS V5R3 SQE Query Coverage
Common table expressions Deletes Derived tables
I5/OS V5R3 SQE Performance Enhancements
Like/Substring predicates DB2 Multisystem LOB columns
Partitioned Table Support
V5R2 Highlights Introduction of the SQL Query Engine
Materialized Query Table Support Fast Delete Support
SQE Optimizer
SQE Database Statistics
SQE Query Engine
Statistic Usage Example
Indexing
SQE for V5R2 Summary
Encoded Vector Indices EVIs
DB2 for i5/OS Memory Sharing Considerations
DB2 Symmetric Multiprocessing feature Introduction
Decision Support Queries
SMP Performance Summary
Journaling and Commitment Control
Journaling
Remote Journal Function
Smapp
System-Managed Access Path Protection Smapp
Commitment Control
DB2 Multisystem for i5/OS
Copyright IBM Corp
Triggers
Referential Integrity
Description
Variable Length Fields
Performance Expectations
Reuse Deleted Record Space
Description of Function
Comparison to Normal Inserts
Performance References for DB2
Copyright IBM Corp
Communications Performance
CCIN3
System i Ethernet Solutions
Communication Performance Test Environment
Hardware
Software
Communication and Storage observations
Dasd Performance
Large data transfer FTP
Streaming Performance
TCP/IP non-secure performance
TCP/IP Secure Performance
RR & Acrr Performance
1167 565.4 530.0 479.6 462.1 202.2
SSL Performance
249.7 53.4 48.0 31.3 27.4
478.4 55.7 53.3 36.9 31.9
VPN Performance
SSL Relative Performance
Performance Observations and Tips
VPN Relative Performance
27.5
10.9 15.4 18.7 88.8
Page
APPC, ICF, CPI-C, and Anynet
Page
HPR and Enterprise extender considerations
Test Type Hprip Link Hprip Link Speed AnyNet
Speed = 10Mbps = 100Mbps
For network information select Networking
Additional Information
Web Server and WebSphere Performance
Http Server powered by Apache
Relative Performance Metrics
Http Server powered by Apache for i5/OS
V5R4 Relative Capacity for CGI
Http Server powered by Apache for i5/OS
Page
Page
Page
Page
PHP Zend Core for
System Configuration
Zend Core for
Database and Workload Description
OS / DB
Database Access
Database Persistent versus Non-Persistent Connections
Zend Platform
Database Isolation Levels
PHP System Sizing
What’s new in V6R1?
WebSphere Application Server
Thi
Sho
Using direct map native Jdbc
Tuning changes in V6R1
Using ‘threadUsed=false custom property toolbox Jdbc
Use of unix sockets toolbox Jdbc
Page
Topology of the Trade Application
Page
WebSphere Application Server
Trade Capacity Results
Trade3 Measurement Results
Trade 6 Primitives
Trade Scalability Results
Description of Trade primitives in Figure
WebSphere Trade 3 Primitives
Accelerator for System
Trade Jdbc Response Time 1 User Time seconds
Page
WebSphere Application Server V51 Express
IBM WebFacing
WebFaced applications, one simple, one
Moderate, and one complex. See .4, for
More in line with the other two machines
Version 5.0 of Webfacing
Many 5250 applications have been implemented
With best performance techniques, such as
Display File Record I/O Processing
Tuning the Record Definition Cache
Cache Size Effect
Cache Management Definition Cache Content Viewer
Definitions would be retained in the cache with few cache
Misses for not commonly used records
Cache Viewer Button operations
Cache Management Record Definition Loader
Button Operation
Compression
Record Definition Loader Button operations Operation
Webfacing Compression
Enabling Compression in IBM Http Server powered by Apache
Additional Resources
PartnerWorld for Developers Webfacing website
WebSphere Host Access Transformation Services Hats
What’s new with V5R4 and Hats
Hats Customization
Hats Customization CPW/User
IBM Systems Workload Estimator for Hats
System Application Server Instance
Page
WebSphere Commerce
WebSphere Portal
WebSphere Commerce Payments Performance Tips and Techniques
Connect for iSeries
Performance Observations/Tips
Connect for iSeries Connector Types
Page
Java Performance
Introduction
What’s new in V6R1
IBM Technology for Java 32-bit and 64-bit
Garbage Collection
Native Code
JIT Compiler
Classic VM 64-bit
Page
Garbage Collection
Bytecode Verification
Functional Considerations
Determining Which JVM to Use
Performance Considerations
General Guidelines
Capacity Planning
Java Performance Tips and Techniques
Classic VM-specific Tips
I5/OS Specific Java Tips and Techniques
Java Language Performance Tips
Consider the special property os400.jit.mmi.threshold
Minimize synchronized methods
Java i5/OS Database Access Tips
Instead, the above procedure should be written as
Pool Database Connections
Resources
IBM Software Solutions
System i Cryptographic Solutions
IBM Hardware Solutions
Cryptography Performance
CSP API Sets
Cryptography Performance Test Environment
Measurement Results
Software Cryptographic API Performance
Bytes/Second
Hardware Cryptographic API Performance
Encryption Threads
Cipher Encrypt Performance
4764
Transactions/second Bytes/second
CCA CSP
Cryptography Observations, Tips and Recommendations
Supported number of 4764 Cryptographic Coprocessors
ISeries NetServer File Serving Performance
ISeries NetServer File Serving Performance
Conclusion/Explanations
Response Time
Page
10.1 DB2 for i5/OS access with Jdbc
Jdbc Performance Tuning Tips
DB2 for i5/OS Jdbc and Odbc Performance
References for Jdbc 10.2 DB2 for i5/OS access with Odbc
Odbc Performance Settings
Page
Microsoft Odbc webpage
References for Odbc
Domino on
Mail and Calendaring Users MCU
Domino Workload Descriptions
Domino
Domino Web Access formerly known as iNotes Web Access
Domino Domain Monitor
Additional memory was added for this test
Domino Web Access client improvements with Domino
Response Time and Megahertz relationship
Collaboration Edition and Domino Edition offerings
Collaboration Edition
Domino Edition
Performance Tips / Techniques
Page
Page
Domino Subsystem Tuning
Domino Web Access
Main Storage Options
Performance Monitoring Statistics
Minimize
Thousands
V5R3 Main Storage Options Response Times
Sizing Domino on System
Performance Data Collection Tools
Lpar and Partial Processor Considerations
System i NotesBench Audits and Benchmarks
Performance Improvements for WebSphere MQ V5.3 CSD6
WebSphere MQ for iSeries
Queue Manager Start Following an Abnormal End
Checkpoint Following a Journal Receiver Roll-over
Conclusions, Recommendations and Tips
Test Description and Results
Other Sources of Information
Linux on iSeries Performance
Basic Requirements -- Where Linux Runs
Summary
Key Ideas
Linux on iSeries Architecture
Linux on iSeries Technical Overview
Linux on iSeries Run-time Support
Basic Configuration and Performance Questions
Computational Performance -- C-based code
General Performance Information and Results
Number Processors Partition
Computational Performance -- Java
Web Serving Performance
Network Operations
TCP/IP Function Megabit Ethernet LAN Virtual LAN
Gcc and High Optimization gcc compiler option -O3
Gcc Compiler, Version
Virtual Disk
Value of Virtual LAN and Virtual Disk
13.7 DB2 UDB for Linux on iSeries
Top Tips for Linux on iSeries Performance
Linux on iSeries and IBM eServer Workload Estimator
Page
Page
Page
Internal Native Attachment
Dasd Performance
Devices & Controllers
Direct Attach Native Hardware Characteristics
Intensive Workload Performance Comparison
14.1.2 iV5R2 Direct Attach Dasd
Intensive Workload
14.1.3 571B
14.1.3.1 571B RAID5 vs RAID6 10 15K 35GB Dasd
14.1.3.2 571B IOP vs Iopless 10 15K 35GB Dasd
Dasd
14.1.4 571B, 5709, 573D, 5703, 2780 IOA Comparison Chart
14.1.4.4
14.1.5.1
14.1.6.2
Comparing 571E/574F and 571F/575B IOP and IOPLess
1000 2000 3000 4000 Ops/Sec
14.1.7.4
14.1.8.1
Performance Limits on the 571F/575B
Page
14.1.9.2 14.1.9.1
Direct Attach 571E/574F and 571F/575B Observations
100 200 300 400 500 600 Ops/Sec
New in iV5R4M5 14.2.1 9406-MMA CEC vs 9406-570 CEC Dasd
RAID Hot Spare
14.2.3 12X Loop Testing
Non Encrypted ASP vs Encrypted ASP
New in iV6R1M0 Encrypted ASP
Non Encrypted ASP vs Encrypted ASP
100 350 600 850 1100 1350 1600 1850
14.3.2 57B8/57B7 IOA
POWER6 520 57B8/57B7 6 RAID5 Dasd in CEC
14.3.3 572A IOA
Page
SAN Storage Area Network External
14.5 iV6R1M0 -- Vios and IVM Considerations
Generic Concepts
General Vios Considerations
Generic Configuration Concepts
Page
Page
Chdev -dev hdisk03 -attr pv=yes will assign a Pvid to hdisk3
Page
Vios and JS12 Express and JS22 Express Considerations
001 10000 20000 30000 40000 50000 60000
Vios
CPU Vios
Average Dasd Response Time Seconds
BladeCenter S and JS12 Express
Page
Page
System Workload Response Time Seconds
IBM i operating system 5.4 Virtual Scsi Performance
Page
Introduction
Virtual Scsi Performance Examples
Virtual Scsi Bandwidth-Multiple Network Storage Spaces
Native vs. Virtual Performance
Nwsd Read Scaling
Virtual Scsi Bandwidth-Disk Scaling
Sizing
Sizing when using Dedicated Processors
CPU milliseconds to process virtual Scsi I/O transaction
Sizing when using Micro-Partitioning
Disk 1GB Sequential Read
Sizing memory
AIX Virtual IO Client Performance Guide
Supported Backup Device Rates
Save/Restore Performance
Use Optimum Block Size Useoptblk
Save Command Parameters that Affect Performance
Data Compression Dtacpr
Data Compaction Compact
Database File related Workloads
Workloads
User Mix
User Mix 3GB contains 12,300 objects
Comparing Performance Data
Lower Performing Backup Devices
Medium & High Performing Backup Devices
Ultra High Performing Backup Devices
Use of Multiple Backup Devices
Parallel and Concurrent Library Measurements
Large File Concurrent
Save and Restore Rates
Large File Parallel
Save and Restore Rates
User Mix Concurrent
User Mix Concurrent Runs
Number of Processors Affect Performance
450 440 430 420
100
Dasd and Backup Devices Sharing a Tower
Virtual Tape
200
Data To Save Hours
Parallel Virtual Tapes
500
Concurrent Virtual Tapes
1500 1000
Large File Virtual Tape Scaling Save Write to Virtual tape
Save and Restore Scaling using a Virtual Tape Drive
Large File Save
User Mix Saves
PCI-X ™ In a 5094/5294 tower use slot C08 or C09
High-End Tape Placement on System
700
250
SLR60
15.19 5XX Tape Device Rates
Measurements in GB/HR all 8 Dasd in the system ASP
Source File 1GB
15.21 5XX DVD RAM and Optical Library
High
Software Compression
ASP
15.23 9406-MMA DVD RAM
1GB
15.24 9406-MMA 576B IOPLess IOA
IV5R4M5 July
What’s New and Tips on Performance What’s New IV6R1M0 March
IV5R4 January
August
IPL Performance
IPL Performance Considerations
IPL Test Description
Software Configuration
16.3 9406-MMA System Hardware Information
Active Database
16.4 9406-MMA IPL Performance Measurements Normal
1 iV5R4M5 Normal IPL Power-On Cold Start
16.5 9406-MMA IPL Performance Measurements Abnormal
1 iV5R4M5 Abnormal IPL Partition MSD
MSD Affects on IPL Performance Measurements
16.7.2 5XX Large system Hardware Configuration
16.7.1 5XX Small system Hardware Configuration
16.7 5XX System Hardware Information
Database
16.8 5XX IPL Performance Measurements Normal
1 Normal IPL Power-On Cold Start
16.9 5XX IPL Performance Measurements Abnormal
Measurement units are in hours, minutes and seconds
IPL Tips
16.10 5XX IOP vs IOPLess effects on IPL Performance Normal
Integrated BladeCenter and System x Performance
V5R4 iSCSI Host Bus Adapter iSCSI HBA
Integrated xSeries Adapter IXA
Effects of Windows and Linux loads on the host system
Integrated xSeries Servers IXS
17.2.1 IXS/IXA Disk I/O Operations
ISCSI Disk I/O Operations
Extended Write Operations
Crtsbsd SBSDQGPL/QFPHIS POOLS1 10000
ISCSI virtual I/O private memory pool
17.2.5 IXS/IXA IOP Resource
Virtual Ethernet Connections
ISCSI attached servers
IXS and IXA attached servers
Machine Pool MBytes Base Pool Qfphis Private Pool Total
Disk I/O CPU Cost
CPW per 1k Disk Operations
Further notes about IXS/IXA Disk Operations
ISCSI Target, IXA Capacity Comparison MB per Second
Disk I/O Throughput
VE Capacity Comparisons
Virtual Ethernet CPU Cost and Capacities
PP TCP Stream i5/OS to Windows
VE CPW Cost
Windows CPU Cost
File Level Backup Performance
Flbu SAV / RST Rates
Additional Sources of Information
Microsoft Hardware Compatibility Test URL See
V5R3 Information
Logical Partitioning Lpar
V5R2 Additions
General Tips
V5R1 Additions
Considerations
Performance on a 12-way system
Lpar Performance Considerations
Page
Lpar Throughput Increase
Lpar Measurements
Over a Standalone 12-way
5920 26 %
5700 21 %
Miscellaneous Performance Information
TPC-C Commercial Performance
SAP Performance Information
VolanoMark
SPECjbb2000
Dynamic Priority Scheduling
Delay Cost Terminology
Priority Mapping to Delay Cost Curves
Qdynptyscd = ‘1’ on Qdynptyscd = ‘0’
Performance Testing Results
Main Storage Sizing Guidelines
Memory Tuning Using the Qpfradj System Value
Additional Memory Tuning Techniques
User Pool Faulting Guidelines
Setobjacc Set Object Access
Large Memory Systems
Batch
Interactive
19.7 AS/400 NetFinity Capacity Planning
AS/400 NetFinity Software Inventory Performance
Conclusions/Recommendations for NetFinity
General Performance Tips and Techniques
Adjusting Your Performance Tuning for Threads
History
Coming Change
Solution
Problem
General Performance Guidelines -- Effects of Compilation
In-lining
Optimization Levels
Theory -- and Practice
Typical Storage Costs
System Level Considerations
Brief Example
Order1 Orderj Ordert OrderN
Short but Important Tip about Data Base
Which is more important?
Final Thought About Memory and Competitiveness
HMT Described
Hardware Multi-threading HMT
HMT and SMT Compared and Contrasted
HMT Feature SMT Feature
Some key similarities and differences are
Models With/Without HMT
POWER6 520 Memory Considerations
Aligning Floating Point Data on Power6
Page
Switchable IASP’s
High Availability Switchable Resources Considerations
High Availability Performance
Workload Description
System Configuration
Workload Configuration
Hardware Configuration
Cabling Map
Geographic Mirroring
Switchover Tips
Workload Description
Hardware Configuration Cabling Map
Large System Configuration
Geographic Mirroring Measurements
Switchable Towers using Geographic Mirroring
Synchronization on an idle system
Active State
Geographic Mirroring Tips
IBM Systems Workload Estimator
Estimator Access
Merging PM for System i data into the Estimator
What the Estimator is Not
Page
Commercial Processing Workload CPW
Appendix A. CPW and CIW Descriptions
CPW Application Description
Compute Intensive Workload CIW
Page
Page
Performance Data Collection Services
How Collection Services works
Starting Collection Services
Batch Modeling Tool Bchmdl
Page
Page
V6R1 Additions October
CPW values for the IBM Power Systems IBM i operating system
CPW values for the IBM Power 595 IBM i operating system
V6R1 Additions August
V6R1 Additions April
V6R1 Additions January
Table C.3.1. CPW values for Power System Models
IBM System i using the POWER5 processor technology
IBM System i using the POWER6 processor technology
V5R4 Additions July
V5R4 Additions January/May/August 2006 and January/April
Model Edition Accelerator
IBM ~ i5 Servers
V5R3 Additions May, July, August, October 2004, July
Value
Express
CPU
ISeries Model 8xx Servers
V5R2 Additions February, May, July
750
540
V5R2 Additions
Model 810 and 825 iSeries for Domino February
Models share L2 cache between 2 processors
Standard Models 8xx Servers
Table C.9.2.1 Standard Models 8xx Servers
10 V5R1 Additions
Table C.9.1.1 Model 8xx Servers
Model 8xx Servers
10.3 V5R1 Dedicated Server for Domino
Model 2xx Servers
Table C.10.2.1 Model 2xx Servers
Table C.10.3 .1 Dedicated Servers for Domino
Capacity Upgrade on-demand Models
CPW Values and Interactive Features for CUoD Models
Active Stand-by 840-2352 840-2353 840-2354
16500
Table C.10.4.1.1 V5R1 Capacity Upgrade on-demand Models
11 V4R5 Additions
11.1 AS/400e Model 8xx Servers
Table C.11.1 Model 8xx Servers All new Condor models
Dedicated Server for Domino
Table C.11.2.1 Model 2xx Servers
Table C.11.3.1 Dedicated Server for Domino
12 V4R4 Additions
SB Models
12.1 AS/400e Model 7xx Servers
Table C.11.4.1 SB Models
Table C.12.2.1 Current Model 170 Servers
Model 170 Servers Current 170 Servers
Previous Model 170 Servers
AS/400e Dedicated Server for Domino
2407 2408 2409 120
Table C.12.2.2 Dedicated Server for Domino
14 AS/400e Custom Servers
13 AS/400e Model Sxx Servers
15 AS/400 Advanced Servers
Table C.13.1 AS/400e Servers
16 AS/400e Custom Application Server Model SB1
Table C.15.1 AS/400 Advanced Servers V4R1 and V4R2
Table C.15.2 AS/400 Advanced Servers V3R7
Table C.16.1 AS/400e Custom Application Server Model SB1
17 AS/400 Models 4xx, 5xx and 6xx Systems
Table C.17.1 AS/400 Risc Systems
Table C.17.2 AS/400e Systems
18 AS/400 Cisc Model Capacities
Table C.18.6 AS/400 Cisc Model 9406 Systems
Table C.18.7 AS/400 Advanced Systems Cisc
Table C.18.8 AS/400 Advanced Servers Cisc