A short guide to tone curve corrections
Image processing is a highly specialized and difficult field that takes years of practice to master. This basic guide to using tone curves covers a few simple procedures to improve your pictures. For more about
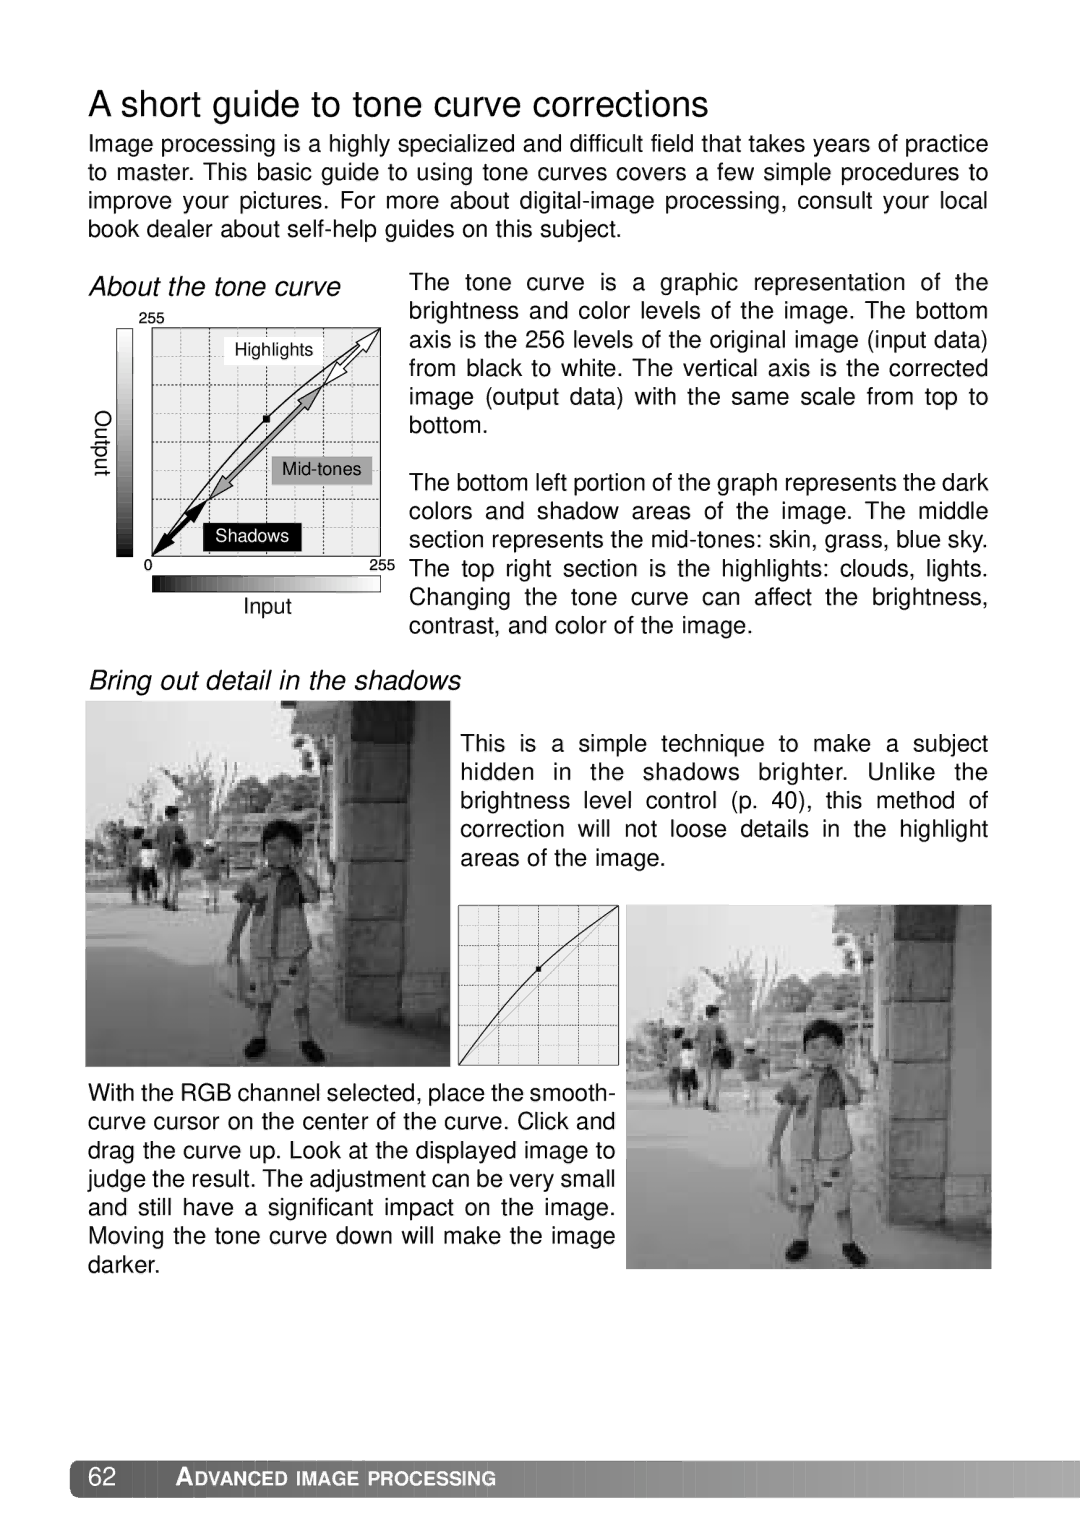
About the tone curve
| Highlights |
Output | |
| Shadows |
| Input |
The tone curve is a graphic representation of the brightness and color levels of the image. The bottom axis is the 256 levels of the original image (input data) from black to white. The vertical axis is the corrected image (output data) with the same scale from top to bottom.
The bottom left portion of the graph represents the dark colors and shadow areas of the image. The middle section represents the
Bring out detail in the shadows
This is a simple technique to make a subject hidden in the shadows brighter. Unlike the brightness level control (p. 40), this method of correction will not loose details in the highlight areas of the image.
With the RGB channel selected, place the smooth- curve cursor on the center of the curve. Click and drag the curve up. Look at the displayed image to judge the result. The adjustment can be very small and still have a significant impact on the image. Moving the tone curve down will make the image darker.
![]() 62
62 ![]()
![]()
![]() ADVANCED IMAGE PROCESSING
ADVANCED IMAGE PROCESSING ![]()
![]()
![]()
![]()
![]()
![]()
![]()
![]()
![]()
![]()
![]()
![]()
![]()
![]()
![]()
![]()
![]()
![]()
![]()
![]()
![]()
![]()
![]()
![]()
![]()
![]()