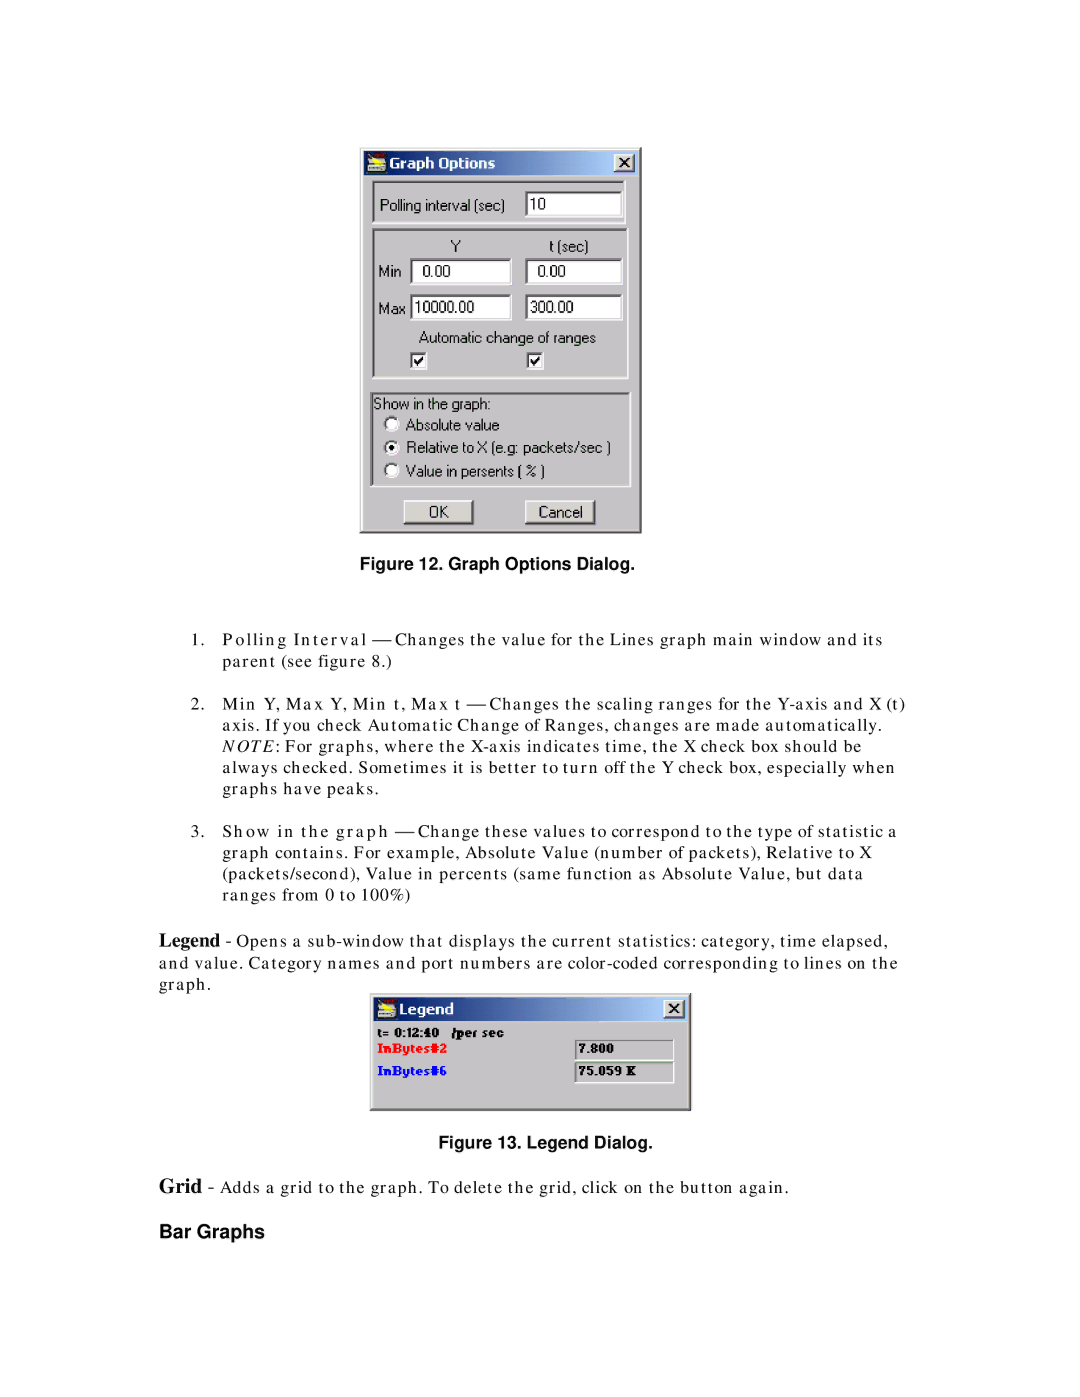
Figure 12. Graph Options Dialog.
1.Polling Interval Changes the value for the Lines graph main window and its parent (see figure 8.)
2.Min Y, Max Y, Min t, Max t Changes the scaling ranges for the
3.Show in the graph Change these values to correspond to the type of statistic a graph contains. For example, Absolute Value (number of packets), Relative to X (packets/second), Value in percents (same function as Absolute Value, but data ranges from 0 to 100%)
Legend - Opens a
Figure 13. Legend Dialog.
Grid - Adds a grid to the graph. To delete the grid, click on the button again.