•Operational Status of the Interface (up/down/testing) – the current operational state of the interface. The testing state indicates that no operational packets can be passed.
Double click on the desired interface line or click on the Statistics and Graphs per Interface button to open Interfaces Statistics (per interface) window (described immediately after this section, figure 22.) This action will display performance information about this particular interface.
Press on the Statistics and Graphs per Counter button to open Interfaces Statistics (per counter), window (described after Interface Statistics window, figure 23.). This action will display performance information about all the interfaces on this particular device The Utilization button brings up a graph window representing the interfaces utilization. This window is described later in this section (figure 24.)
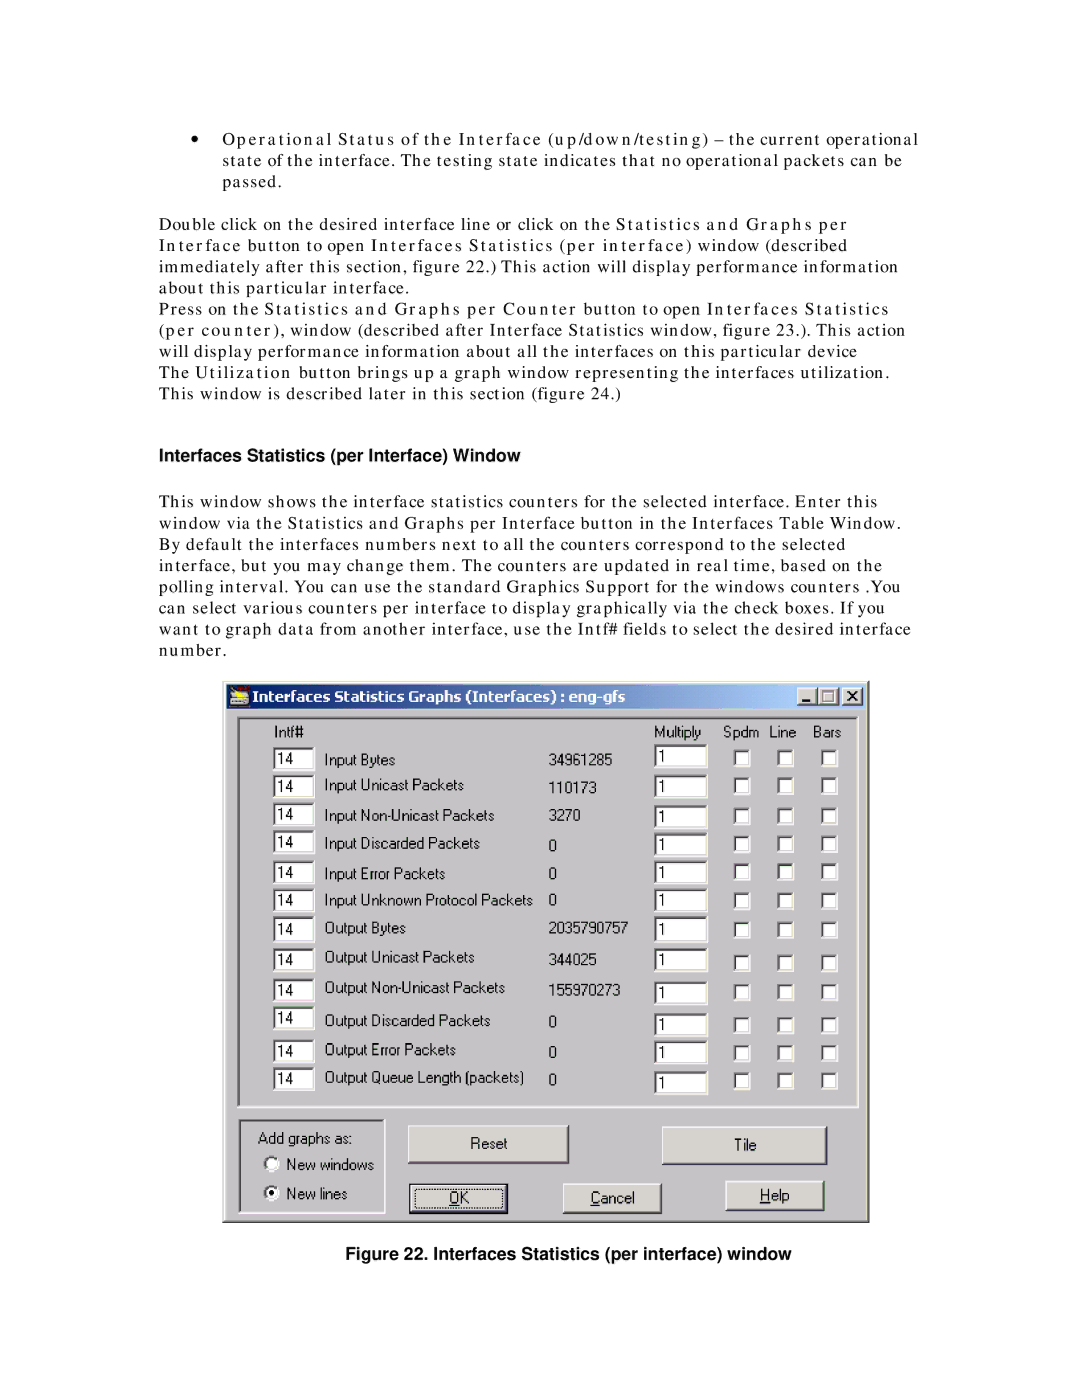
Interfaces Statistics (per Interface) Window
This window shows the interface statistics counters for the selected interface. Enter this window via the Statistics and Graphs per Interface button in the Interfaces Table Window. By default the interfaces numbers next to all the counters correspond to the selected interface, but you may change them. The counters are updated in real time, based on the polling interval. You can use the standard Graphics Support for the windows counters .You can select various counters per interface to display graphically via the check boxes. If you want to graph data from another interface, use the Intf# fields to select the desired interface number.