directory contains information how to see/modify the full list of monitored services. You can use the standard MegaVision Graphics Support (see the Graphics Support section) in order to view the corresponding services performance graphs.
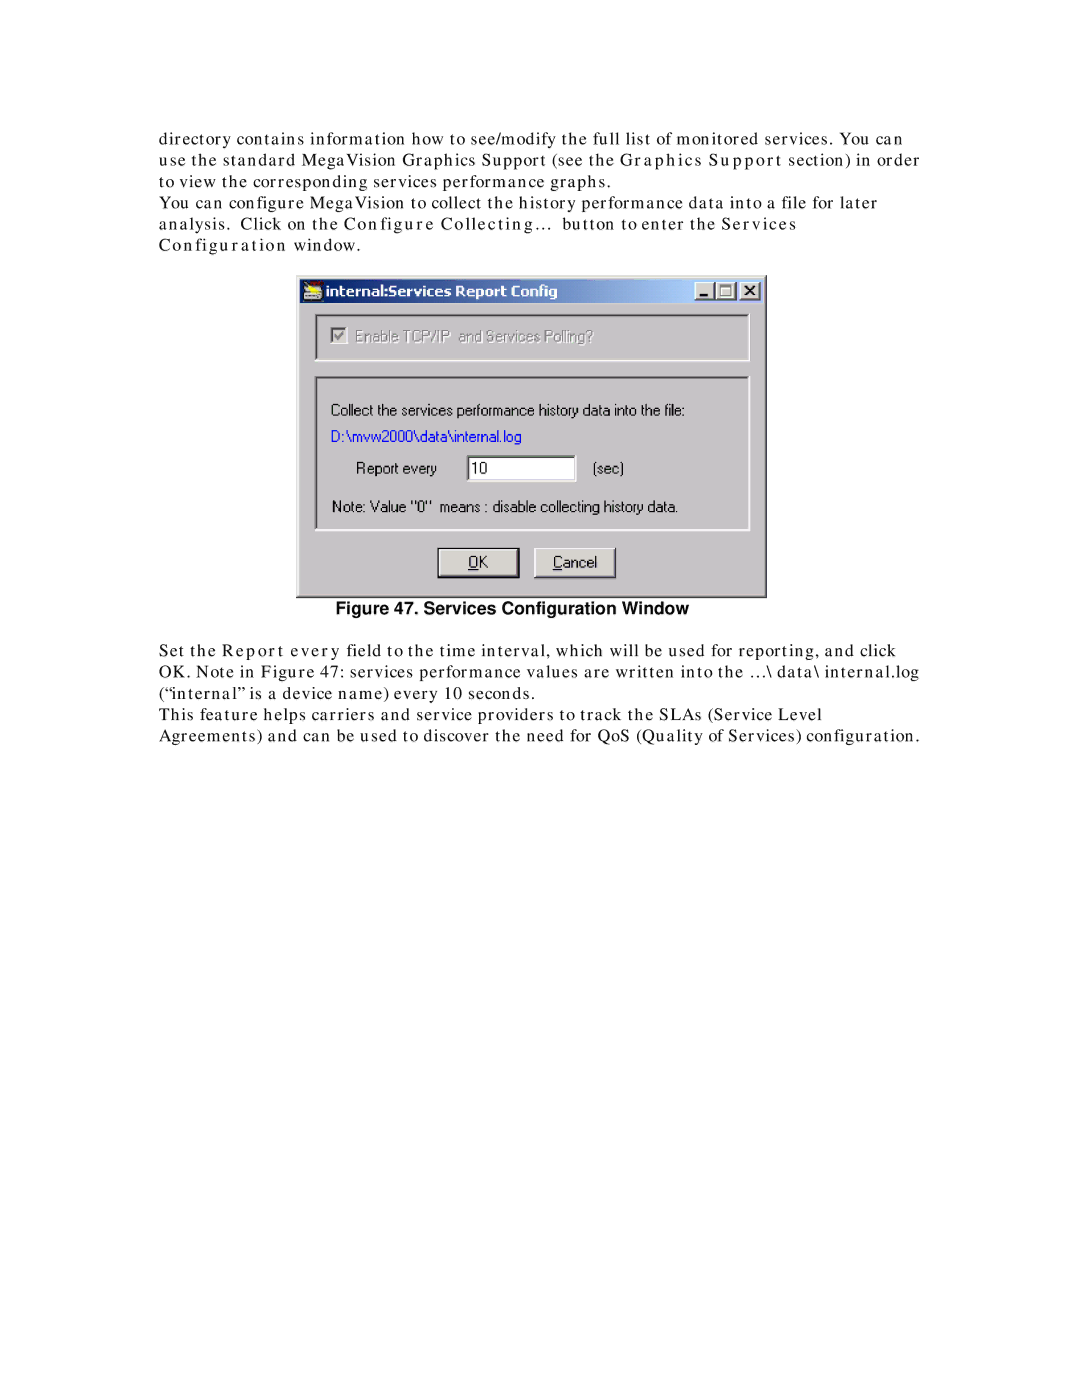
You can configure MegaVision to collect the history performance data into a file for later analysis. Click on the Configure Collecting… button to enter the Services Configuration window.
Figure 47. Services Configuration Window
Set the Report every field to the time interval, which will be used for reporting, and click OK. Note in Figure 47: services performance values are written into the …\data\internal.log (“internal” is a device name) every 10 seconds.
This feature helps carriers and service providers to track the SLAs (Service Level Agreements) and can be used to discover the need for QoS (Quality of Services) configuration.
