Line Graphs
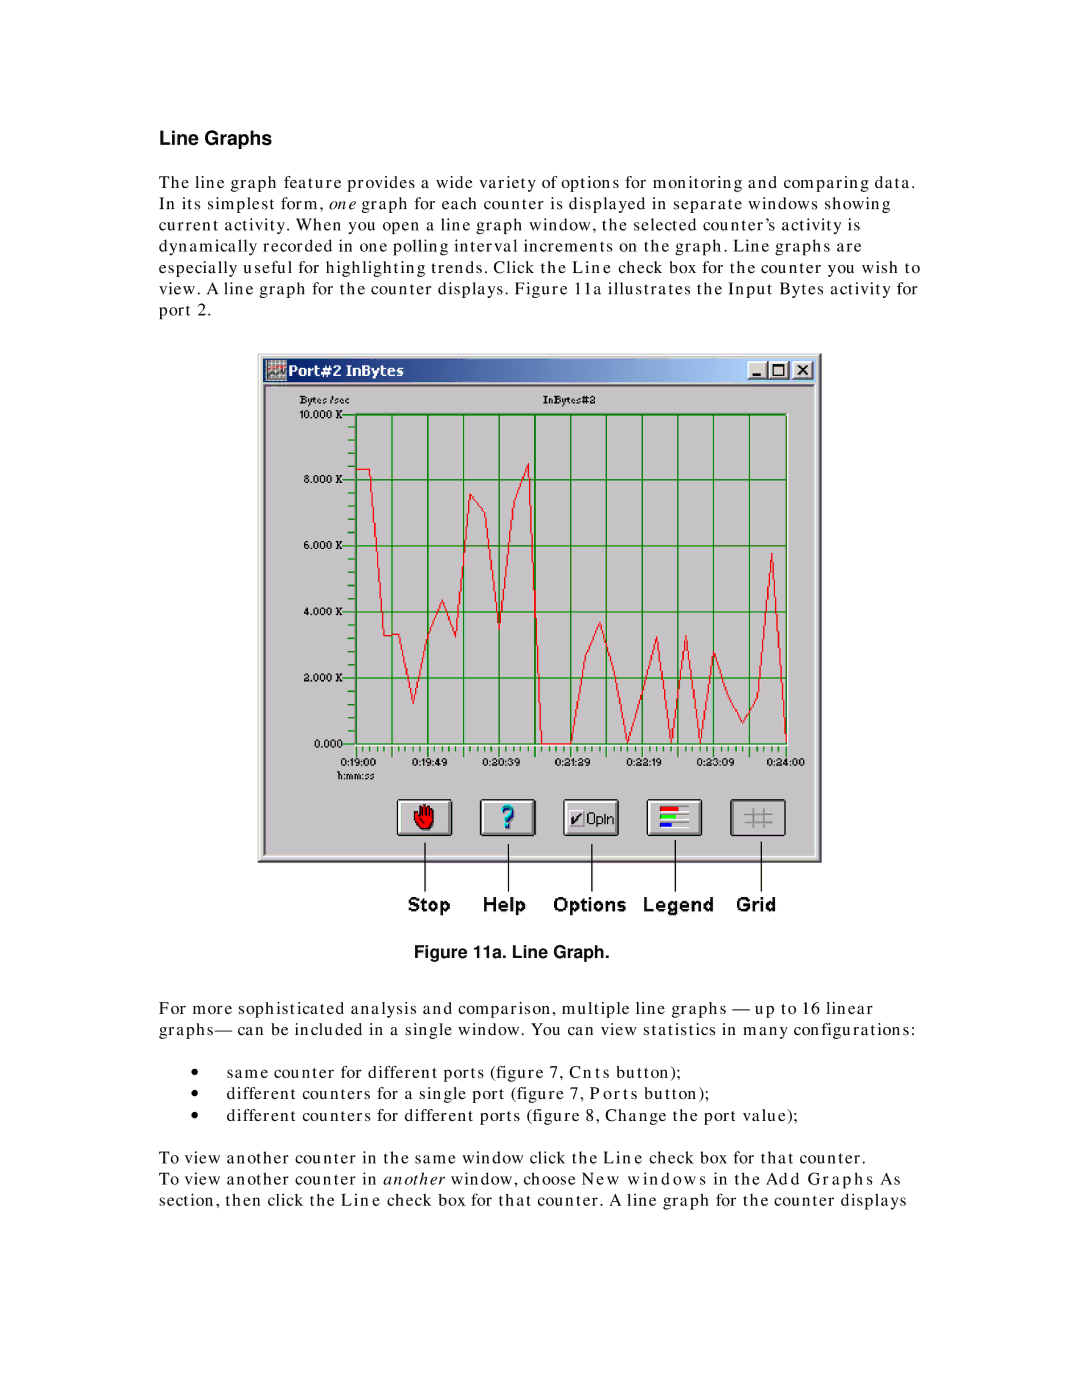
The line graph feature provides a wide variety of options for monitoring and comparing data. In its simplest form, one graph for each counter is displayed in separate windows showing current activity. When you open a line graph window, the selected counter’s activity is dynamically recorded in one polling interval increments on the graph. Line graphs are especially useful for highlighting trends. Click the Line check box for the counter you wish to view. A line graph for the counter displays. Figure 11a illustrates the Input Bytes activity for port 2.
Figure 11a. Line Graph.
For more sophisticated analysis and comparison, multiple line graphs — up to 16 linear graphs— can be included in a single window. You can view statistics in many configurations:
•same counter for different ports (figure 7, Cnts button);
•different counters for a single port (figure 7, Ports button);
•different counters for different ports (figure 8, Change the port value);
To view another counter in the same window click the Line check box for that counter.
To view another counter in another window, choose New windows in the Add Graphs As section, then click the Line check box for that counter. A line graph for the counter displays