MegaVision Network Management System manual Multiple Line Graphs

Models: Network Management System

1 62
Download 62 pages 58.96 Kb
Page 21
Image 21

in a new window.

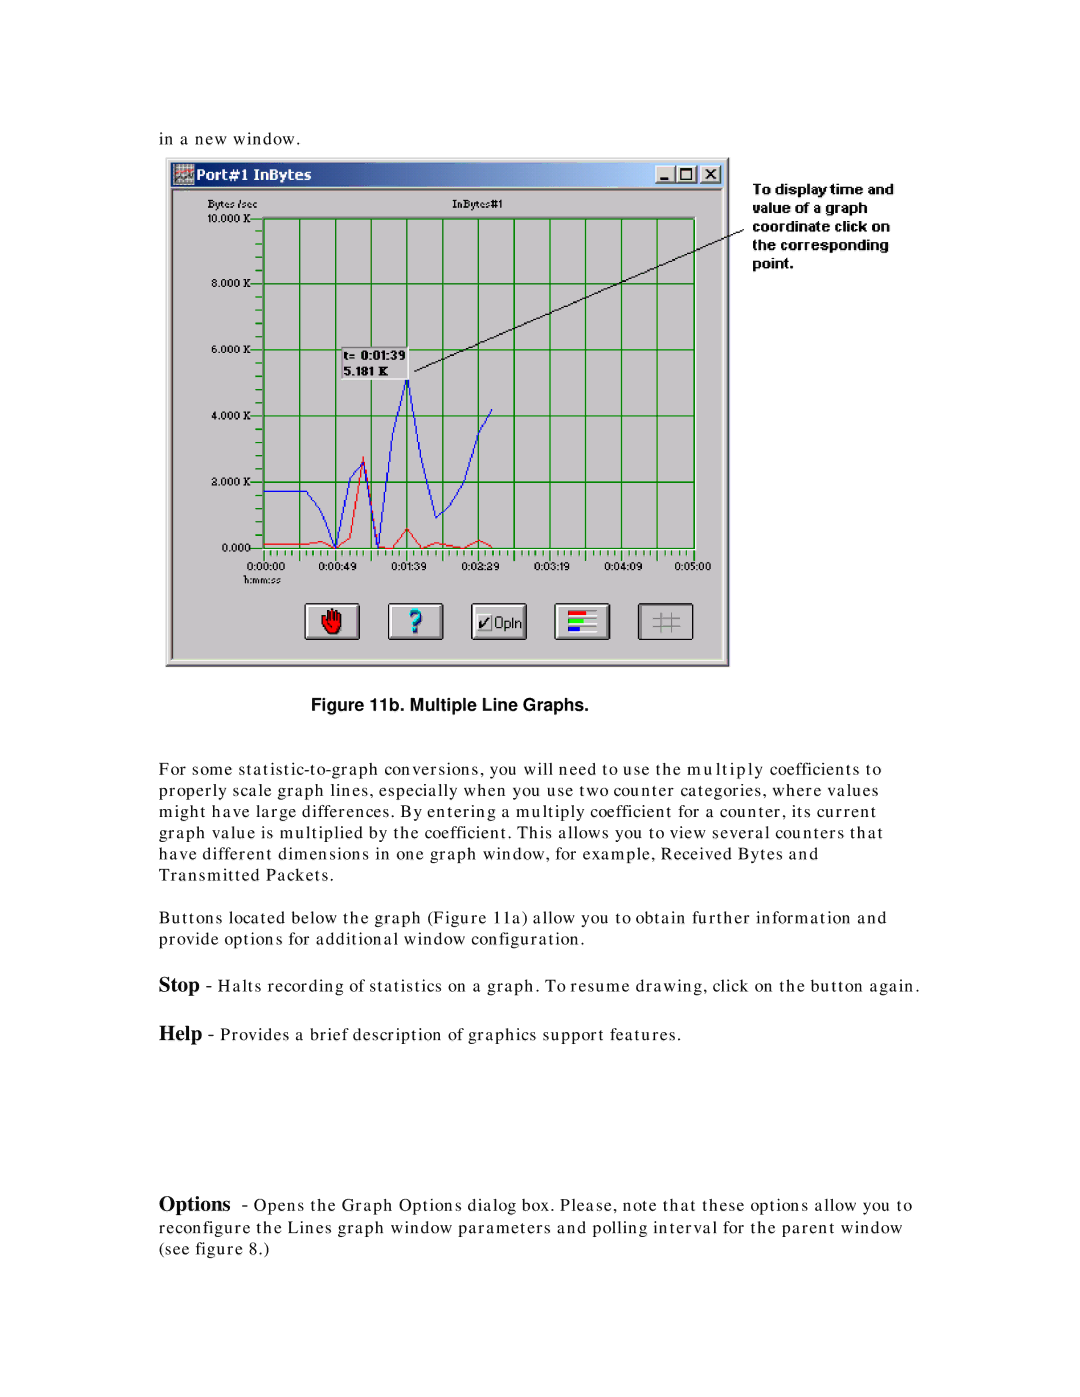
Figure 11b. Multiple Line Graphs.

For some statistic-to-graph conversions, you will need to use the multiply coefficients to properly scale graph lines, especially when you use two counter categories, where values might have large differences. By entering a multiply coefficient for a counter, its current graph value is multiplied by the coefficient. This allows you to view several counters that have different dimensions in one graph window, for example, Received Bytes and Transmitted Packets.

Buttons located below the graph (Figure 11a) allow you to obtain further information and provide options for additional window configuration.

Stop - Halts recording of statistics on a graph. To resume drawing, click on the button again.

Help - Provides a brief description of graphics support features.

Options - Opens the Graph Options dialog box. Please, note that these options allow you to reconfigure the Lines graph window parameters and polling interval for the parent window (see figure 8.)

Page 21
Image 21
MegaVision Network Management System manual Multiple Line Graphs