|
|
|
|
|
|
| ENGLISH |
|
|
|
|
|
|
|
|
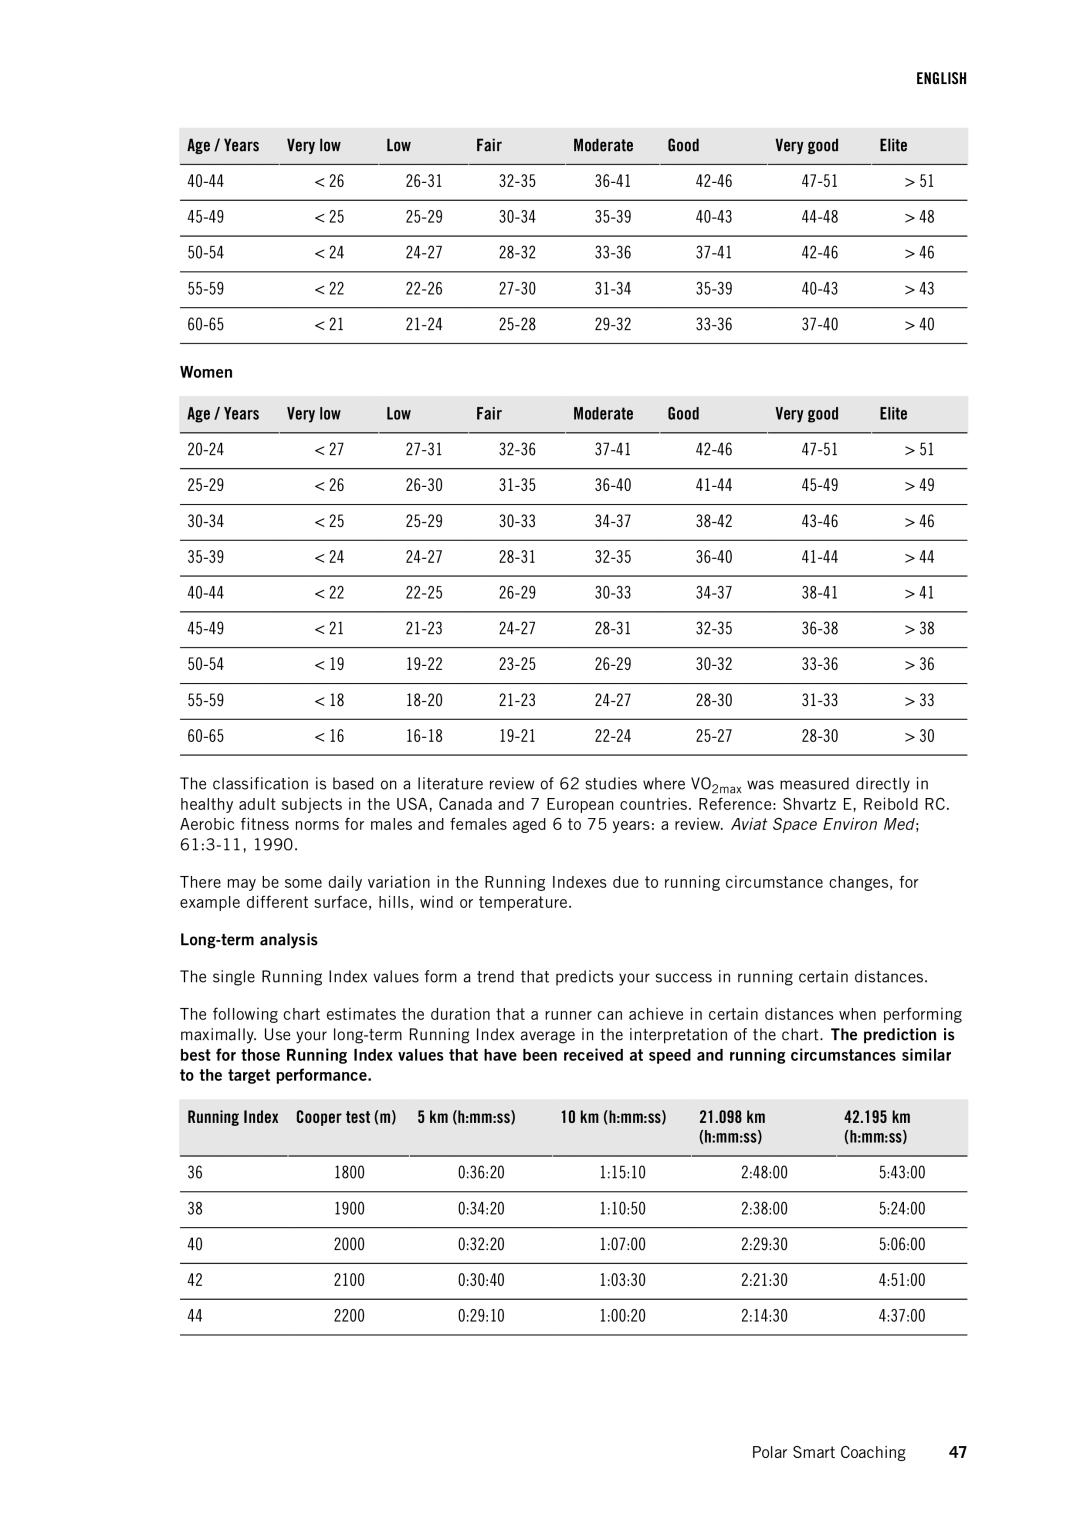
Age / Years | Very low | Low | Fair | Moderate | Good | Very good | Elite |
|
|
|
|
|
|
|
|
< 26 | > 51 | ||||||
|
|
|
|
|
|
|
|
< 25 | > 48 | ||||||
|
|
|
|
|
|
|
|
< 24 | > 46 | ||||||
|
|
|
|
|
|
|
|
< 22 | > 43 | ||||||
|
|
|
|
|
|
|
|
< 21 | > 40 | ||||||
|
|
|
|
|
|
|
|
Women |
|
|
|
|
|
|
|
|
|
|
|
|
|
|
|
Age / Years | Very low | Low | Fair | Moderate | Good | Very good | Elite |
|
|
|
|
|
|
|
|
< 27 | > 51 | ||||||
|
|
|
|
|
|
|
|
< 26 | > 49 | ||||||
|
|
|
|
|
|
|
|
< 25 | > 46 | ||||||
|
|
|
|
|
|
|
|
< 24 | > 44 | ||||||
|
|
|
|
|
|
|
|
< 22 | > 41 | ||||||
|
|
|
|
|
|
|
|
< 21 | > 38 | ||||||
|
|
|
|
|
|
|
|
< 19 | > 36 | ||||||
|
|
|
|
|
|
|
|
< 18 | > 33 | ||||||
|
|
|
|
|
|
|
|
< 16 | > 30 | ||||||
|
|
|
|
|
|
|
|
The classification is based on a literature review of 62 studies where VO2max was measured directly in healthy adult subjects in the USA, Canada and 7 European countries. Reference: Shvartz E, Reibold RC. Aerobic fitness norms for males and females aged 6 to 75 years: a review. Aviat Space Environ Med;
There may be some daily variation in the Running Indexes due to running circumstance changes, for example different surface, hills, wind or temperature.
Long-term analysis
The single Running Index values form a trend that predicts your success in running certain distances.
The following chart estimates the duration that a runner can achieve in certain distances when performing maximally. Use your
best for those Running Index values that have been received at speed and running circumstances similar to the target performance.
Running Index | Cooper test (m) | 5 km (h:mm:ss) | 10 km (h:mm:ss) | 21.098 km | 42.195 km |
|
|
|
| (h:mm:ss) | (h:mm:ss) |
|
|
|
|
|
|
36 | 1800 | 0:36:20 | 1:15:10 | 2:48:00 | 5:43:00 |
|
|
|
|
|
|
38 | 1900 | 0:34:20 | 1:10:50 | 2:38:00 | 5:24:00 |
|
|
|
|
|
|
40 | 2000 | 0:32:20 | 1:07:00 | 2:29:30 | 5:06:00 |
|
|
|
|
|
|
42 | 2100 | 0:30:40 | 1:03:30 | 2:21:30 | 4:51:00 |
|
|
|
|
|
|
44 | 2200 | 0:29:10 | 1:00:20 | 2:14:30 | 4:37:00 |
|
|
|
|
|
|
Polar Smart Coaching | 47 |