NetBook
Version 1.0, September English
USA
Radio and Television Interference
Emissions information for Canada
Class 1 LED Product
Contents
100
Contents
101
102
108
107
109
111
154
153
155
156
195
194
196
203
Getting started
Getting Started
About the netBook
Getting started
Catch IR window
Lithium backup battery door
Reset button
About PsiWin
Using this manual
Turning on & off
Switching on
Fitting the batteries
Screen
Finding & using the pen
First steps
Navigating between files & folders
Title bar Folder Current folder
Programs & files
Starting programs
Entering information
Using dialogs
Radio button
Dialog
Copying information between programs
Dialog buttons
Displaying Help
Search clue
Help topic card
Things to do first
Setting the time, date & the Home city
Time & date icon
Entering owner information
Setting a system password
Which programs to use?
Things to do next
You may also wish to
Using PsiWin
Connecting the netBook to the PC
Backing up to a PC
Backing up to Memory Disks
Control panel
Moving around
FILES, Folders & Programs
Change disk
Close folder
Closing programs/files
Opening files, folders & programs
Creating new folders
What names can I use for my files & folders?
Creating new files
Files & folders
Folders
Browsing folders
Finding files and folders
Changing file attributes
Using passwords
Managing folders
Which files use the most memory?
Checking memory use
Can I run Series 3/3a/3c/3mx/5/5mx programs on a netBook?
Additional disks & programs
Word
Word
Entering text
Top toolbar
Changing the appearance of text
Finding & replacing text
Menu or the Clipboard
Formatting paragraphs
Bullets & symbols
Aligning paragraphs
Indents & tabs
Line spacing
Special characters
Paragraph borders
Style button
Using styles
Defining styles
Document outlines
Moving around the document outline
Inserting an object
Information from other programs
Creating a new file
Spell checking
File templates
Creating a template
Document template
How the page looks
Saving Word files
Breaks
Headers, footers & page numbers
Printing
Setup
Sheet
Sheet
Column heading Row heading
Sheet has two views
Entering information
Or column and tap
Performing calculations
Use = to enter formulae
Recalculation
Using ranges
Functions
Naming ranges
Sorting information
Changing how information is displayed
Sorting from top to bottom
To sort from top to bottom
Sorting from left to right
Changing the number format
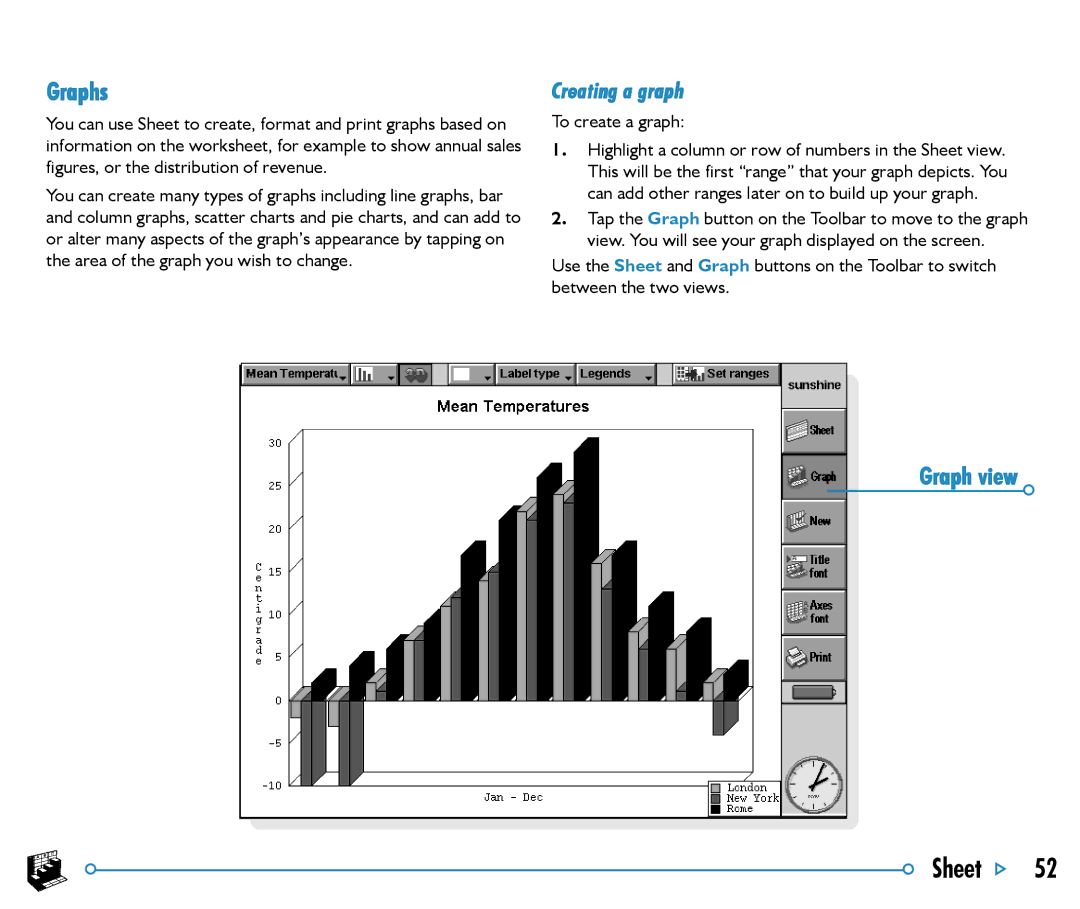
Creating a graph
Graphs
To create a graph
Adding a range to a graph
Replacing the graph range
Graph type & appearance
Adding titles, labels and grid lines
Printing from Sheet
Working with more than one graph
Contacts
Contacts
Adding a contact
Looking at your contacts
Finding contacts
List of contacts
Contact labels
Editing & deleting contacts
Changing labels
Label
Printing contacts
Exchanging contacts
Search results Search clue
Agenda
Agenda
To-do entry
Adding appointments & events
Events
Timed & untimed entries
Pencilling in a tentative entry
To enter a timed or untimed day entry
Event entry
Viewing entries
Reminders for entries alarms
Entry symbols
Entries which have alarms are marked with a bell symbol
Birthdays and anniversaries
Alarm warning
Finding entries and dates
Using the calendar
Deleting entries & crossing out
Changing and deleting entries
Lists and things to do
Repeating entries
Adding a to-do
Creating a new to-do list
To-do priority
Select To-do list preferences from the To-do lists menu
Customising a To-do list
Attaching Word documents to entries
Attaching a sketch
Attaching a voice note
You can add a sketch in one of 2 ways
Agenda files
Customising Agenda
Tidying an Agenda file
Printing Agenda entries
Synchronising with a PC Scheduler
Year view Entry symbol
Synchronising entries with a PC scheduler
Marked with a , private entries are marked with a
Where to find out more
Setting UP WEB and Email
Before you start…
How can I use Web on my netBook?
If you don’t have an Internet/email account
What type of email accounts can I use?
What do I need to use Web/Email?
Setting up your netBook
Telephone connection
What information do I need?
Information checklist
Glossary of terms
Information you need Where to find it Write it here
Web & Email Setup
Optional information Where to find it Write it here
Connecting your modem
Setting up Email on your netBook
Setting up your dialling location
Modem options
Setting up your modem
Setting up your Internet service
Untick this option
Either tick the box or enter valid DNS addresses
Enter email address
Setting up the Email program
Enter your Outgoing mail server address
Enter your mailbox username and password
Web
WEB
Read this first
Navigating the Web
Link Location line
To view a saved image
Saving pages
Home and search pages
Customising
Images
Using bookmarks
To organise your bookmarks
Listbox Radio buttons Submit button
Using forms
Loading images
To display all the images on the current
Downloading files
Cache & memory usage
Using proxy servers
Proxy exceptions
To set a proxy server for Web pages
Keypresses
Customising the display
Status information
Fonts
Finding text on a Web
Sending mail from a Web
To stop using cookies
Plain text authentication
Cookies
Viewing Html source
Using plug-ins
To view the Web page as normal
Managing emails
Local folders Remote mailbox
Local folders
Writing an email
Saving unfinshed messages as drafts
Message editor Recipients Message text
Outbox folder
Sending email
Receiving email
Replying to & forwarding emails
Viewing an email
Original author
Attached file
Attaching files to messages
To find out more
Disconnecting
To disconnect from the Internet
Calc
Calc
Till roll
General calculations
Using the memory
Percentage calculations
Scientific calculations
To perform a calculation in the Scientific view
Operator precedence
Using the memories
Re-using answers and calculations
Memory contents
Trigonometric functions
Powers, roots & reciprocals
Angle formats
Factorials
Displaying numbers
Logarithms
Exponent notation
Jotter
Jotter
Adding a note
Split view Entry date
Formatting the text
Inserted sketch
Inserting other information
Deleting entries
Finding a note
Sorting entries
Customising Jotter
Printing Jotter entries
Jotter files
Alarms
Using alarms
Time
Time
Responding to an alarm
Setting an alarm
Alarm warning
Silencing alarms
Changing & deleting alarms
Viewing alarms
Next alarms
Home city
Using the map
Selecting a country or city
Adding a town or city
Adding a country
Customising Time
When you travel
Setting summer time
Northern Early April to end of October Southern
Time
Data
Data
Labels Card
Adding an entry
Labels
Looking at entries
Sorting entries
To change the contents of an entry
Customising Data
Finding an entry
Customising the database
Adding labels
Printing Data entries
Sketch
Sketch
Drawing sketches
Selecting & moving objects
Changing a sketch
Transparency
∙ To make the selected area opaque so that any underlying
Erasing & undoing
Adding text
Changing colours
Cutting out, cropping & re-sizing
Printing sketches
Inserting clipart
Clipart Inserted text
Zoom To view pixels
Sketch files
Spell
Spell
Spell-checking and correction
Solving anagrams
Using the thesaurus
Finding missing letters Xword
Adding words to Spell
Record
Record
Playback point
Recording a sound
Playing sounds
Loudspeaker
File sizes and compression
Bombs
BOMBS- the Netbook Game
Scoring
How to play
Program
Programming
Creating & running OPL programs
You can
Programming options
Where can I find PsiWin?
Installing PsiWin
Psiwin
PsiWin
Tips on using PsiWin help
Where can I find more help?
Getting help
You can display the help topics by
Getting connected
Connecting the cable
Open flap
Selecting a COM port
Connecting with PsiWin
Working with your files
Connecting for the first time
Looking at files on your netBook
‹ Explorer
How to copy a file
Backing up your netBook
Performing your first backup
Opening Psion files from your PC
What is synchronization?
Scheduling regular backups
Synchronizing your netBook
Printing
Setting up the printer
Printing
Printing to a parallel printer
Printing using Infrared
Printing to a serial printer
Using PsiWin to print via a PC
Printing to a file
Selecting the printer model
Print preview
Previewing a document
∙ To change the printer model and method, select Printer
Printing a document
Infrared
Infrared
Transferring the information
Selecting data to transfer
Ready to send by infrared
Cancelling the transfer
When the transfer is complete
Infrared window
If the transfer fails
Dialling
Dialling
You can dial a number as follows
Entering phone numbers
Setting up
Dialling phone numbers
Dialling
Customising Your Netbook
Recording your own alarms
Customising
Creating your own wallpaper
Customising
Expanding
Expanding Your Netbook
CF Card
Press
PC Card
RAM card slot cover
RAM cards
Docking Station
Docking connector
Care & Safety
Care & Safety
Powering the netBook
Pull battery out
Slide battery door back
Changing the batteries
Insert the pen
Prolonging battery life
Battery safety
Security & backups
Security & Backups
Restoring files from a backup
See the PsiWin on-line help for details
Security & backups
Troubleshooting
Troubleshooting
If an alarm doesn’t ring
If a file appears to have vanished
If you forget your password
If the netBook doesn’t seem to turn on/turn off
How do I reset the netBook?
Reset hole
If you can’t connect your cable
Appendices
Appendices
Character set
IBM codepage
Specification
Appendices
Index
Symbols
Alphabetical order in Data
Attributes 29 automatic
Calc program 117 calculations
Calibrating the screen 20 cancelling
Due dates for To-do entries
Date
Fn key 23 folders
Files & icons 9 finding
Html
Number of years in Agenda
On/off switching on/off 6, 20
Proxy servers
Symbols in Agenda 74 synchronising Agenda 76 Synchronizing
Squaring numbers in Calc 123 standby mode
Tentative entries in Agenda 63 testing alarms
Tidying Agenda files 74 till roll in Calc
Time
Index