RIC-155
Page
RIC-155
Limited Warranty
General Safety Instructions
Please observe the following precautions
Connection of DC Mains
General Safety Practices
Connection of AC Mains
Ports Safety Status
Connection of Data and Telecommunications Cables
Electromagnetic Compatibility EMC
Canadian Emission Requirements
Conventions
Product Name
Safety
Manufacturers Name Manufacturers Address
Supplementary Information
Quick Start Guide
Installing RIC-155
Configuring RIC-155
Configuring RIC-155
To configure RIC-155
Contents
Troubleshooting and Diagnostics
Appendix A. Connector Wiring Appendix B. Traffic Separation
Versions
Chapter Introduction
Overview
Application
STM-1/OC-3c Interface
Features
10/100BaseT Interface
Fiber Optic Interface Options
Internal Bridge
Alarm Relay
Management
Status Reporting
Physical Description
RIC-155 3D View
RIC-155 Block Diagram
Functional Description
Technical Specifications
Alarm Types Major and minor Connector DB-9, female
Temperature 50C / 32-122F Humidity Up to 90%, non-condensing
Introduction
Site Requirements and Prerequisites
Chapter Installation and Setup
Introduction
Package Contents
Connecting the Interface Cables
Connecting DC Power
Connecting the Power Cable
Connecting AC Power
Connecting the Power Cable
Turning On RIC-155
Controls and Indicators
Chapter Operation
To turn on RIC-155
RIC-155 LEDs
RIC-155 Normal Indicator Status
Indicator Status
Name Function Location
Default Settings
RIC-155 Default Settings
Managing RIC-155 via Terminal Port
Configuration Alternatives
Parameter Default Value
Uplink
Starting Terminal Session for a First Time
Managing RIC-155 via Ethernet Ports
Preparing the Terminal
To prepare RIC-155 for network management
To start a ConfiguRAD session
Navigating the Management Menus
Loging on
To enter the user name and password
Menu Map
Correcting Entries
To choose an option ConfiguRAD session
Choosing Options
To choose an option terminal session
Logging Out
Turning Off RIC-155
Navigating Tables
Operation Turning Off RIC-155
To access the Configuration menu
Chapter Configuration
Configuring RIC-155 for Management
To access the Management menu
Entering Device Information
To enter device information
Configuring the Host Parameters
To define the IP parameters
Configuring the Network Managers
To configure the network managers
Controlling the Management Access
To define the management access method
Configuring the RIC-155 for Operation
To enable or disable management ports
Configuring the Clock Source
Configuring Control Port Parameters
Changing the Control Port Data Rate
Enabling and Disabling Pop-up Alarms
Configuring the Security Timeout
Configuring the STM-1/OC-3c Interface
Configuring the Physical Ports
Configuring the Ethernet Interface
J1 Path Trace
10E-3,10E-4,10E-5
10E-5,10E-6,10E-7,10E-8,10E-9
Line Signal Degraded Error
Uplink Port Signal Loss
Line Excessive Error Defect
Uplink Port Loss of Signal
To configure the Fast Ethernet bridge
Configuring the Internal Bridge
Configuring Fast Ethernet Bridge
Mbps, 8 Mbps, No Limit
To access the Bridge Port menu
Configuring the Bridge Ports
Configuring Ethernet Management and Data Bridge Ports
To configure the Ethernet management and data bridge ports
Configuring the POS Bridge Port
To configure the POS port
To display the system information
Displaying the RIC-155 Status
Displaying the System Status
To display the Ethernet port status
Displaying the Port Status
Displaying the Ethernet Port Status
To display the STM-1/OC-3c port status
Displaying the STM-1/OC-3c Port Status
DATA/MNG Port Status Parameters
Parameters Values
Additional Tasks
Changing the Password
To change the current password
STM-1/OC-3c Port Status Parameters
21. User Access Menu
Displaying the RIC-155 Inventory
To install a new software release via Tftp
Installing Software Releases
Installing a New Software Release via Tftp
Installing a New Software Release via Xmodem
To install a new software release via Xmodem
To download a configuration file
Transferring Configuration Files
To upload a configuration file
Displaying the Software Version
To switch software versions
Switching Software Versions
Resetting RIC-155
To reset RIC-155 to the defaults
Resetting RIC-155 to Factory Defaults
Resetting RIC-155
To reset RIC-155
Displaying the Ethernet Statistics
Chapter Troubleshooting Diagnostics
Monitoring Performance
To display the Ethernet statistics
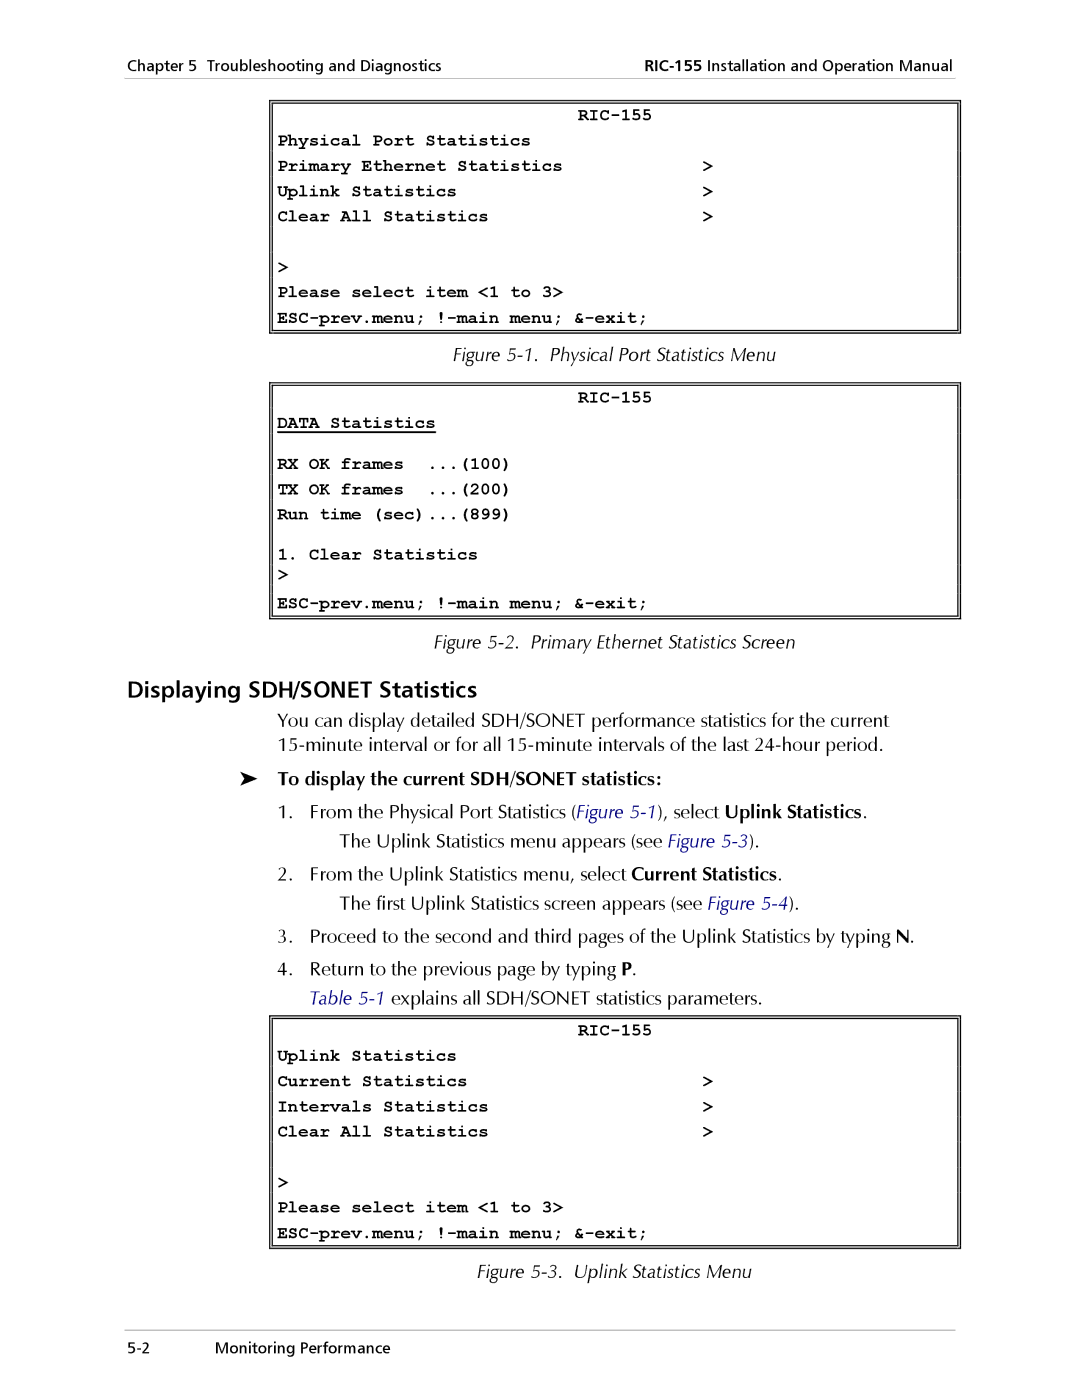
Displaying SDH/SONET Statistics
To display the current SDH/SONET statistics
Uplink Statistics Screen,
Display Description Range
Uasl
RCV Abort
To display SDH/SONET statistics for all intervals
1explains all SDH/SONET statistics parameters
Power-Up Self-Test
Detecting Errors
Handling Alarms
Front Panel LEDs
Working with the Log File
Displaying System Alarms
To display the system alarms
To display the event log file
To clear the event log
Configuring Alarm Severity
To configure the alarm severity
RIC-155 Alarms and Warnings
Masking Port Alarms
To mask RIC-155 alarms
Terminal Message Description Severity
RIC-155 Events
Number Terminal Message Description
Troubleshooting and Diagnostics Handling Alarms
Alarm Relay Connector
Appendix a Connector Wiring
Ethernet Connectors
Table A-1. ETH and MNG-ETH Connector Pinout
Table A-3. Control Connector Pinout
Control Connector
Table A-2. Alarm Connector Pinout
Pin Alarm Relay Function
None
Appendix B Traffic Separation
Port-Based Traffic Separation
MNG only
Local Mng Only
Port-Based/VLAN-Based Traffic Separation
All
Tagging Modes of the Bridge Ports
Default Tagging
Table B-1. Default Tagging Modes
Uplink and Host Ports
Internal Operation Modes of the Bridge Ports
Forwarding Mode Port Filter
Management Access Mode None MNG Only All Local MNG Only
None
MNG Only
All
Local MNG Only
Configuring for a Typical Application
Managing RIC-155 via MNG Port
Managing RIC-155 via Data Port
Figure B-9. Managing RIC-155 via MNG Port
Figure B-10. Managing RIC-155 via Data Port
Index
RADview-Lite,3-5
STM-1/OC-3c interface, 1-2,1-6
Customer Response Form
Excellent Good Fair Poor Very Poor
Page
Error Report
Page
Page
International Headquarters