Agilent Technologies E4406A VSA Series
User’s Guide
Transmitter Tester
Safety Information
LIMITATION OF WARRANTY
Warranty
EXCLUSIVE REMEDIES
Page
Using System Features
Contents
Getting Started
3.Setting the Mode
Contents
4. Making Measurements
Changing the Measurement Setup . . . . . . . . . . . . . . . . . . . . . . . . . . . . . . . . . . . . . . . . . . . 133 Changing the Display . . . . . . . . . . . . . . . . . . . . . . . . . . . . . . . . . . . . . . . . . . . . . . . . . . . . . . 135 Using the Marker . . . . . . . . . . . . . . . . . . . . . . . . . . . . . . . . . . . . . . . . . . . . . . . . . . . . . . . . . 135 Troubleshooting Hints . . . . . . . . . . . . . . . . . . . . . . . . . . . . . . . . . . . . . . . . . . . . . . . . . . . . . 135 Making the Power Stat CCDF Measurement . . . . . . . . . . . . . . . . . . . . . . . . . . . . . . . . . . . . . 136 Purpose . . . . . . . . . . . . . . . . . . . . . . . . . . . . . . . . . . . . . . . . . . . . . . . . . . . . . . . . . . . . . . . . . 136 Measurement Method . . . . . . . . . . . . . . . . . . . . . . . . . . . . . . . . . . . . . . . . . . . . . . . . . . . . . . 136 Making the Measurement . . . . . . . . . . . . . . . . . . . . . . . . . . . . . . . . . . . . . . . . . . . . . . . . . . 137 Results . . . . . . . . . . . . . . . . . . . . . . . . . . . . . . . . . . . . . . . . . . . . . . . . . . . . . . . . . . . . . . . . . . 137 Changing the Measurement Setup . . . . . . . . . . . . . . . . . . . . . . . . . . . . . . . . . . . . . . . . . . . 138 Changing the View . . . . . . . . . . . . . . . . . . . . . . . . . . . . . . . . . . . . . . . . . . . . . . . . . . . . . . . . 139 Changing the Display . . . . . . . . . . . . . . . . . . . . . . . . . . . . . . . . . . . . . . . . . . . . . . . . . . . . . . 139 Using the Markers . . . . . . . . . . . . . . . . . . . . . . . . . . . . . . . . . . . . . . . . . . . . . . . . . . . . . . . . 140 Troubleshooting Hints . . . . . . . . . . . . . . . . . . . . . . . . . . . . . . . . . . . . . . . . . . . . . . . . . . . . . 140 Service Measurements . . . . . . . . . . . . . . . . . . . . . . . . . . . . . . . . . . . . . . . . . . . . . . . . . . . . . . . 141 Timebase Frequency . . . . . . . . . . . . . . . . . . . . . . . . . . . . . . . . . . . . . . . . . . . . . . . . . . . . . . . . 142 Purpose . . . . . . . . . . . . . . . . . . . . . . . . . . . . . . . . . . . . . . . . . . . . . . . . . . . . . . . . . . . . . . . . . 142 Measurement Method . . . . . . . . . . . . . . . . . . . . . . . . . . . . . . . . . . . . . . . . . . . . . . . . . . . . . . 142 Test Setup . . . . . . . . . . . . . . . . . . . . . . . . . . . . . . . . . . . . . . . . . . . . . . . . . . . . . . . . . . . . . . . 142 Results . . . . . . . . . . . . . . . . . . . . . . . . . . . . . . . . . . . . . . . . . . . . . . . . . . . . . . . . . . . . . . . . . . 143 50 MHz Amplitude . . . . . . . . . . . . . . . . . . . . . . . . . . . . . . . . . . . . . . . . . . . . . . . . . . . . . . . . . 144 Purpose . . . . . . . . . . . . . . . . . . . . . . . . . . . . . . . . . . . . . . . . . . . . . . . . . . . . . . . . . . . . . . . . . 144 Measurement Method . . . . . . . . . . . . . . . . . . . . . . . . . . . . . . . . . . . . . . . . . . . . . . . . . . . . . . 144 Test Setup . . . . . . . . . . . . . . . . . . . . . . . . . . . . . . . . . . . . . . . . . . . . . . . . . . . . . . . . . . . . . . . 144 Results . . . . . . . . . . . . . . . . . . . . . . . . . . . . . . . . . . . . . . . . . . . . . . . . . . . . . . . . . . . . . . . . . . 145 Sensors . . . . . . . . . . . . . . . . . . . . . . . . . . . . . . . . . . . . . . . . . . . . . . . . . . . . . . . . . . . . . . . . . . . 146 Purpose . . . . . . . . . . . . . . . . . . . . . . . . . . . . . . . . . . . . . . . . . . . . . . . . . . . . . . . . . . . . . . . . . 146 Measurement Method . . . . . . . . . . . . . . . . . . . . . . . . . . . . . . . . . . . . . . . . . . . . . . . . . . . . . . 146 Test Setup . . . . . . . . . . . . . . . . . . . . . . . . . . . . . . . . . . . . . . . . . . . . . . . . . . . . . . . . . . . . . . . 146 Results . . . . . . . . . . . . . . . . . . . . . . . . . . . . . . . . . . . . . . . . . . . . . . . . . . . . . . . . . . . . . . . . . . 146 Front Panel Test . . . . . . . . . . . . . . . . . . . . . . . . . . . . . . . . . . . . . . . . . . . . . . . . . . . . . . . . . . . 148 Purpose . . . . . . . . . . . . . . . . . . . . . . . . . . . . . . . . . . . . . . . . . . . . . . . . . . . . . . . . . . . . . . . . . 148 Test Setup . . . . . . . . . . . . . . . . . . . . . . . . . . . . . . . . . . . . . . . . . . . . . . . . . . . . . . . . . . . . . . . 148 Results . . . . . . . . . . . . . . . . . . . . . . . . . . . . . . . . . . . . . . . . . . . . . . . . . . . . . . . . . . . . . . . . . . 149 Troubleshooting Hints . . . . . . . . . . . . . . . . . . . . . . . . . . . . . . . . . . . . . . . . . . . . . . . . . . . . . 149 Service Power vs. Time Measurement . . . . . . . . . . . . . . . . . . . . . . . . . . . . . . . . . . . . . . . . . . 150 Purpose . . . . . . . . . . . . . . . . . . . . . . . . . . . . . . . . . . . . . . . . . . . . . . . . . . . . . . . . . . . . . . . . . 150 Using Baseband I/Q Inputs Option B7C . . . . . . . . . . . . . . . . . . . . . . . . . . . . . . . . . . . . . . . 151 What are Baseband I/Q Inputs? . . . . . . . . . . . . . . . . . . . . . . . . . . . . . . . . . . . . . . . . . . . . . . 152 What are Baseband I/Q Signals? . . . . . . . . . . . . . . . . . . . . . . . . . . . . . . . . . . . . . . . . . . . . . 153 Why Make Measurements at Baseband?. . . . . . . . . . . . . . . . . . . . . . . . . . . . . . . . . . . . . . . 153 Making Measurements with Baseband I/Q Inputs . . . . . . . . . . . . . . . . . . . . . . . . . . . . . . 154 Baseband I/Q Measurement Overview . . . . . . . . . . . . . . . . . . . . . . . . . . . . . . . . . . . . . . . . 155 Selecting Input Probes for Baseband Measurements . . . . . . . . . . . . . . . . . . . . . . . . . . . . . 156 Selecting Baseband I/Q Inputs. . . . . . . . . . . . . . . . . . . . . . . . . . . . . . . . . . . . . . . . . . . . . . . 159 Selecting Baseband I/Q Input Connectors. . . . . . . . . . . . . . . . . . . . . . . . . . . . . . . . . . . . . . 159 Setting Up Baseband I/Q Inputs . . . . . . . . . . . . . . . . . . . . . . . . . . . . . . . . . . . . . . . . . . . . . 161 Baseband I/Q Measurement Views . . . . . . . . . . . . . . . . . . . . . . . . . . . . . . . . . . . . . . . . . . . 165 Baseband I/Q Measurement Result Examples
Contents
5. If You Have a Problem
Contents
6. Options and Accessories
List of Keys
Front Panel Test
List of Keys
Reference
List of Keys
List of Keys
Getting Started
Topics include
Standard Documentation
Table
Part Description
Part Description
Table
Personality Documentation
Measurement Option
Agilent Part
URL for the Latest VSA Transmitter Tester Update
Understanding Digital Communications Measurements
Description
Getting Started
Updating the Firmware
Chapter
Primary Key
Making a Measurement
Setup Keys
Step
System
Front Panel Keys Context Dependency
MEASURESetup
Service GSM cdmaOne Waveform Time Domain
Spectrum Freq Domain Spurious Close Channel Power
Meas View/Setup Trace
Getting Started
Channel Power
Setup
Marker
MEASURESetup
Service GSM cdmaOne Waveform Time Domain
Spectrum Freq Domain Spurious Close Channel Power
Meas View/Setup Trace
2.Control keys
Front Panel Description
Chapter
Getting Started Front Panel Description
6.Mode keys select the measurement mode and mode parameters See page 83 for more detail
Chapter
Getting Started Front Panel Description
12.Floppy Disk Drive. The floppy disk drive accepts 1.44 megabyte disks. For an explanation of the operation of the floppy disc drive see the Using Print Keys section on page
be implemented with a future firmware update
Getting Started Rear Panel Description
Rear Panel Description
Chapter
measurements. The external trigger accepts an
11. PARALLEL The PARALLEL connection supports remote printing
Display Annotation
Measurement Bar. Displays information about
ESec even second clock - The green ESec
Available Personality Options
Installing Optional Measurement Personalities
Available Personality Options
Loading the Optional Personality
Required Information
Key Path
Viewing a License Key
Using the Uninstall Key
Installing a License Key
Page
Figure 1-5HP 24542U Cable
Cables for Connecting to the Serial Port RS-232
Figure 1-6HP F1047-80002Cable
HP 92219J Cable
Cables for Connecting to the Serial Port RS-232
Figure 1-7HP 24542G/H Cable
Figure
Figure 1-12Mouse Adapter typical
Cables for Connecting to the Serial Port RS-232
Figure 1-10HP 24542M Modem Cable
Figure 1-11HP C2913A/C2914A Cable
Figure 1-15HP 24542U Cable with 5181-6642Adapter
Cables for Connecting to the Serial Port RS-232
Figure 1-13HP 24542U Cable with 5181-6641Adapter
Figure 1-14HP 24542U Cable with 5181-6640Adapter
Figure 1-16HP 24542U Cable with 5181-6639Adapter
Figure 1-19HP F1047-80002Cable with 5181-6642Adapter
Instrument Installation
Safety Considerations
Instrument Operation and Maintenance
Safety Considerations for Service Personnel
Chapter
Getting Started Safety Considerations
Using System Features
Install and Uninstall
Using System Keys
Key Access Locations
Key Locations
Table
Key Locations
Using System Features
Chapter
Key Access Path
Key Access Locations
Table
Using System Features
Table
Key Access Locations
Using System Features Key Locations
Key Access Path
Table
Key Access Locations
Using System Features Key Locations
Key Access Path
Table
Key Access Locations
Using System Features
Key Access Path
Key Locations
Key Access Locations
Using System Features
Key Access Path
Chapter
Using System Features
Key Locations
Input/Input Port
Chapter
Using System Features Key Locations
Key Locations
Key Access Locations
Using System Features
Key Access Path
Printing a Displayed Screen
Using Print and Print Setup Functions
Level
language default to
when Color Print is set to
Front Panel Key
Using Print and Print Setup Functions
Using System Features
Chapter
available only when
selected
the six screen files
shown below are
Loading a State
Using File and Save Keys
Saving a State
Level
Using the Alpha Editor Keys
Level
Level
Configuring I/O
Using Input/Output Configuration Keys
•SCPI LAN - Accesses the following keys
Level
File System
Reference
Front Panel
•10 MHz Out - Activates, or deactivates, the 10 MHz out signal on the rear panel of the instrument. The 10 MHz out can be used to lock other test equipment to the same frequency reference that is used by the transmitter tester. Once activated, the 10 MHz out feature is persistent, so if it is set to On it will remain on, even if the instrument has been preset, or powered off and then on
Restore System Defaults
Using System Configuration and Alignment Keys
Show Errors
Show System
features are described in the service guide
Chapter
Using System Features
Using System Configuration and Alignment Keys
Show System Displays
Chapter
System Local
Using System Features
Using System Configuration and Alignment Keys
Level
Alignment
Front
Level
remains constant
Using System Configuration and Alignment Keys
Using System Features
Chapter
Using System Configuration and Alignment Keys
Using System Features
Chapter
Setting the Mode
Setting the Mode Selecting a Mode
Selecting a Mode
Chapter
Input Keys
Mode Setup
Adjust the IF Align Signal
Adjust Input Attenuation and Input Power
•RF Burst Wideband •Video IF Envlp
Trigger Keys
•Sync Source key menu
Selecting the Frequency/Channel
4 Making Measurements
Basic Measurements
Using Measure Keys
Initial Setup
Preparing for Measurements
Measurement Control
Measurement Setup
Averaging
Voltage Avg - The voltage is averaged
Trigger Source
Span / X Scale Keys
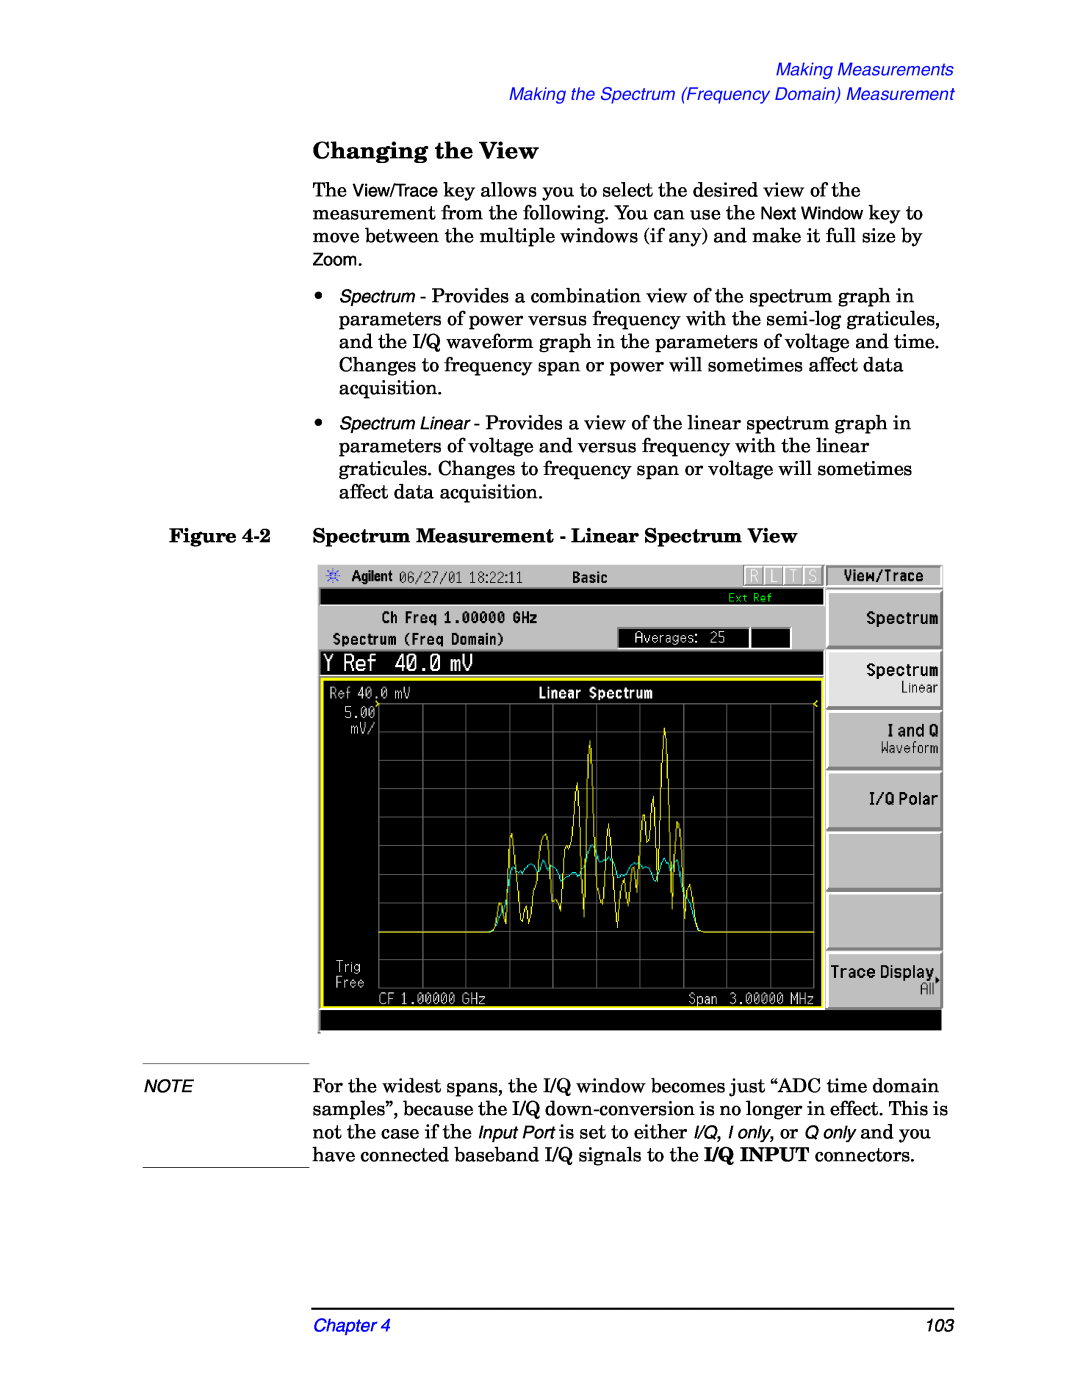
Changing the View
•Typical Measurement Windows
•Trace Display
•Amplitude / Y Scale Keys
Trace
Using Markers
Markers
Search Marker
Marker Functions
Making the Measurement
Making the Spectrum Frequency Domain Measurement
Purpose
Measurement Method
Results
Making Measurements
Changing the Measurement Setup
Spectrum Frequency Domain Measurement Defaults
Table
measurement data
Auto
Auto Peak - Select this to set the ADC range automatically to the peak signal level. Auto peak is a compromise that works well for both CW and burst signals
Chapter
Changing the View
Making Measurements
Making the Spectrum Frequency Domain Measurement
Figure 4-4Spectrum Measurement - I/Q Polar View
Changing the Linear Spectrum Display
Changing the Display
Changing the I or Q Waveform Window
Making the Spectrum Frequency Domain Measurement
Changing the I/Q Polar Window
Selecting Displayed Traces Within Windows
Making Measurements
Measuring Band Power
Using the Markers
Chapter
Troubleshooting Hints
Making Measurements
Making the Spectrum Frequency Domain Measurement
Making the Measurement
Making the Waveform Time Domain Measurement
Purpose
Measurement Method
Results
Input signal: cdma2000 Rev 8, SR1, 9 Channel
Making the Waveform Time Domain Measurement
Making Measurements
Chapter
Waveform Time Domain Measurement Defaults
Changing the Measurement Setup
Table
In addition, the following parameters can be modified
Making the Waveform Time Domain Measurement
Making Measurements
Chapter
Changing the View
Meas Setup: View/Trace = I/Q Waveform View
Figure 4-9Waveform Measurement - I/Q Polar View
Changing the Display
Making the Waveform Time Domain Measurement
Making Measurements
Chapter
•Off - Allows you to turn off the selected marker
Using the Markers
differing values for the maximum point
Troubleshooting Hints
Measurement Method
Making the Adjacent Channel Power ACP Measurement
Making the Adjacent Channel Power ACP Measurement
Purpose
Table
ACP Setup Recommendation
Making the Measurement
Results
Figure 4-10ACP Measurement - Bar Graph View
Changing the Measurement Setup
Adjacent Channel Power Measurement Defaults
Making the Adjacent Channel Power ACP Measurement
Chapter
Making the Adjacent Channel Power ACP Measurement
Making Measurements
Maximum
Offset A 750.000 kHz Offset B 1.98000 MHz
Chapter
•Limit Test - Turns off the limit test function
Changing the View
Chapter
Making the Adjacent Channel Power ACP Measurement
Figure 4-11ACP Measurement - Spectrum View
Making Measurements
This adjacent channel power ratio measurement can reveal degraded or defective parts in the transmitter section of the UUT. The following examples are those areas to be checked further
Troubleshooting Hints
Measurement Method
Making the Channel Power Measurement
Making the Channel Power Measurement
Purpose
Figure
Channel Power Measurement
Making the Measurement
Results
Channel Power Measurement Defaults
Changing the Measurement Setup
Table
Page
Troubleshooting Hints
Using the Marker
Changing the Display
Purpose
Making the Power Stat CCDF Measurement
Measurement Method
Figure
Power Statistics CCDF Measurement
Making the Measurement
Results
Power Statistics CCDF Measurement Defaults
Changing the Measurement Setup
Table
Making Measurements
Making the Power Stat CCDF Measurement
Changing the View
Changing the Display
Troubleshooting Hints
Using the Markers
•Off - Allows you to turn off the selected marker
Front Panel Test on page Pwr vs Time on page
Service Measurements
Measurement Method
Test Setup
Timebase Frequency
Purpose
Window Two Magnitude
Window Three Freq Error
Results
Window One Time Record
Measurement Method
50 MHz Amplitude
Test Setup
Purpose
Window Two Cal Magnitude
Window Three Error
Results
Window One RF Magnitude
Measurement Method
Sensors
Test Setup
Purpose
Chapter
Making Measurements Sensors
Test Setup
Front Panel Test
Purpose
Chapter
Troubleshooting Hints
Results
Making Measurements Front Panel Test
Making Measurements
Service Power vs. Time Measurement
Service Power vs. Time Measurement
Purpose
Using Baseband I/Q Inputs Option B7C
What are Baseband I/Q Inputs?
Why Make Measurements at Baseband?
What are Baseband I/Q Signals?
Making Measurements with Baseband I/Q Inputs
Chapter
Baseband I/Q Measurement Overview
Using Baseband I/Q Inputs Option B7C
Making Measurements
Selecting Input Probes for Baseband Measurements
Making Measurements
Using Baseband I/Q Inputs Option B7C
Chapter
Agilent Probes - Balanced and Unbalanced
Table
Selecting Baseband I/Q Inputs
Selecting Baseband I/Q Input Connectors
•IF Align - Select to view the IF alignment signal. This signal is available as a diagnostic function, to check the operation of the alignment signal in the case of alignment failure. Once selected, a menu accessing the IF alignment signal parameters is available at the bottom of the Input menu. Either CW, comb, or pulse signals may be selected. Because the alignment signal is input at the IF frequency, it is displayed on any active Spectrum Freq Domain window, regardless of center frequency
I/Q Range Settings by Displayed Unit of Measure
Setting Up Baseband I/Q Inputs
Table
I/Q Range
Table
I and Q Offset Increment vs. I/Q Range
I and Q
Making Measurements
Using Baseband I/Q Inputs Option B7C
Chapter
Selecting Baseband I/Q Input Impedance
Spectrum Views and 0 Hz Center Frequency
Baseband I/Q Measurement Views
Waveform Views for Baseband I/Q Inputs
Measurement
Comparing RF and Baseband I/Q Measurement Views
Table
RF vs. Baseband I/Q Input Measurement Views, by
Channel Power Measurement
Baseband I/Q Measurement Result Examples
Chapter
Using Baseband I/Q Inputs Option B7C
Spectrum Frequency Domain Measurement
Making Measurements
Figure 4-19Basic Mode Spectrum Linear View- Baseband I/Q Inputs
Waveform Time Domain Measurement
Baseband I/Q Key Access Locations
Baseband I/Q Key Access Locations
Table
Making Measurements
Baseband I/Q Key Access Locations
Using Baseband I/Q Inputs Option B7C
Table
Baseband I/Q - Waveform I/Q Marker Query
BbIQ Programming Commands
CALCulate Subsystem
Baseband I/Q - Spectrum I/Q Marker Query
Spectrum - Y-AxisReference Level
Baseband I/Q - IQ Offset Calibration
DISPlay Subsystem Spectrum - Y-AxisScale/Div
Sets the amplitude reference level for the y-axis
Baseband I/Q - Activate IQ Alignment
INPut Subsystem
Baseband I/Q - Select Input Impedance
Baseband I/Q - Select Input Impedance Reference
MEASure Subsystem
Baseband I/Q - Select I/Q Power Range
SENSe Subsystem Select the Input Signal
Baseband I/Q - Select I/Q Voltage Range
Instrument Messages and Functional Tests document
5 If You Have a Problem
Key or Feature Does Not Appear in Menu
Problem Symptoms and Solutions
Problem Symptoms and Solutions
LAN External Loopback Test Failed - Error Message
Instrument Fails Alignment - Error Message
If You Have a Problem
LAN Communication Problem
Instrument Power-OnProblem
Instrument Keyboard is Locked
Agilent Technologies Test and Measurement
Support, Services, and Assistance
Chapter
Table 5-1Contacting Agilent
Returning Your Instrument to Agilent Technologies
Asia Call Center Numbers
Options and Accessories
Option BAE: NADC/PDC Measurement Personalities
Options and Measurement Personalities
Option BAH: GSM Measurement Personality
Option BAC: cdmaOne Measurement Personality
Option BAF W-CDMAMeasurement Personality
Option HN1: iDEN Measurement Personality
Option B78: cdma2000 Measurement Personality
Option 202: EDGE with GSM Measurement Personality
Option B7C: Baseband IQ Measurement Personality
Option 0B1: Additional Copy of Manuals
Option 300: 321.4 MHz IF Output
Option 1CN Handles Kit
Option 0BV: Component-levelService Documentation
Option 0BW: Assembly-levelService Documentation
Option 1CM Rack Mount Kit
GPIB Cable
Accessories
Broadband Preamplifiers and Power Amplifiers
AC Probe
Description
N2714A Calibration and Adjustment Software
RS-232Cables
Model Number
Index
Index
Numerics
Index
Index
Index
Index
off, 140 select, 140 shape, 140 trace,
state
Index
Index
Index
Index