Chapter 8 Working with Linksets
Viewing
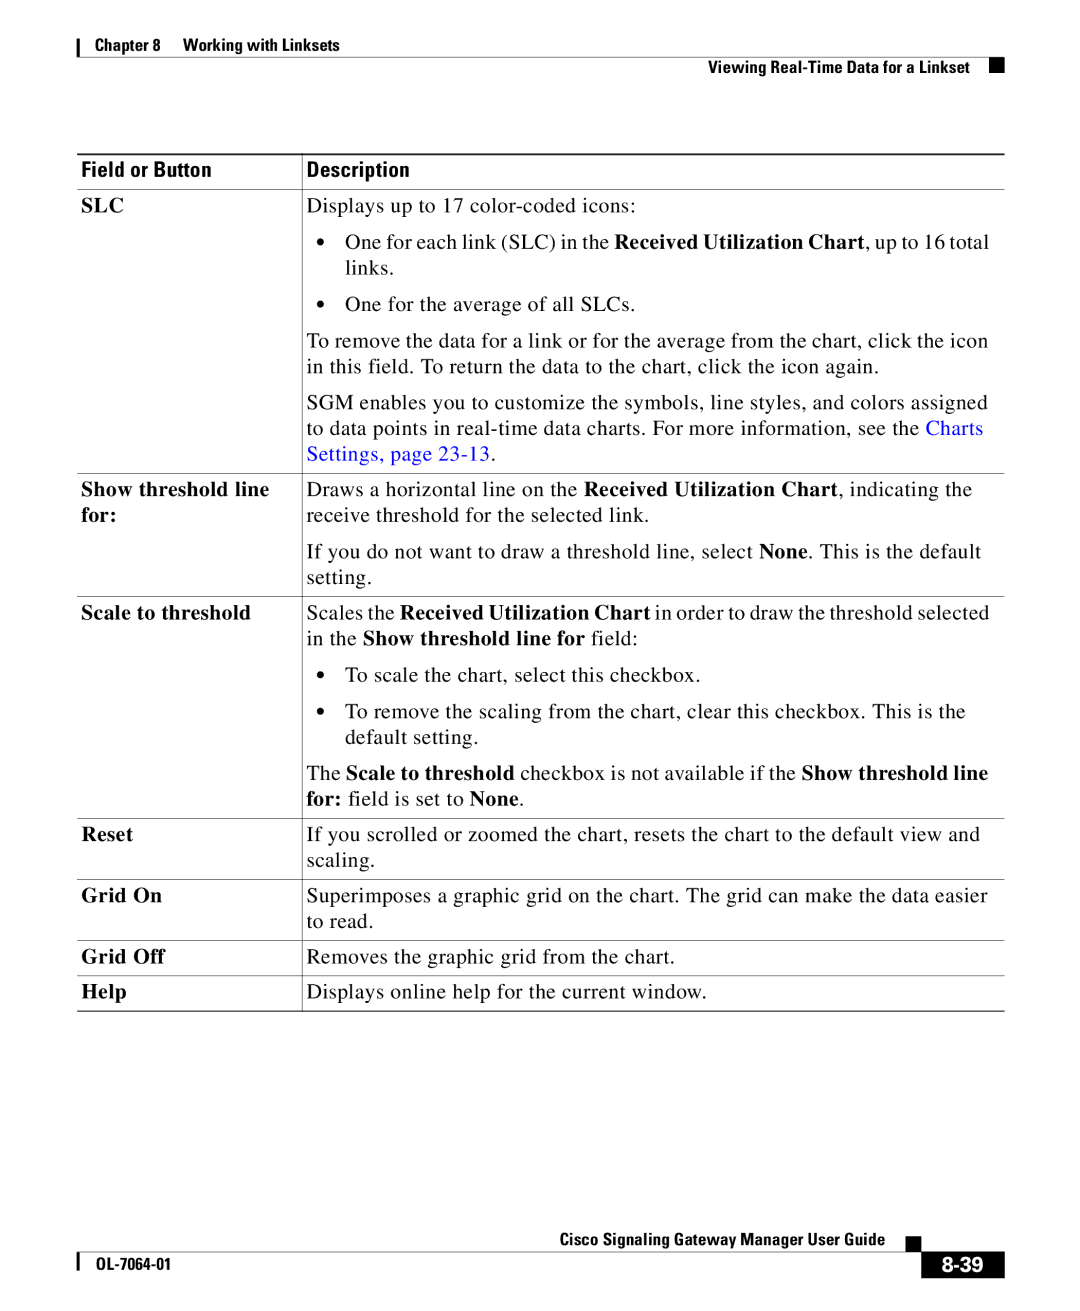
Field or Button | Description |
|
|
SLC | Displays up to 17 |
| • One for each link (SLC) in the Received Utilization Chart, up to 16 total |
| links. |
| • One for the average of all SLCs. |
| To remove the data for a link or for the average from the chart, click the icon |
| in this field. To return the data to the chart, click the icon again. |
| SGM enables you to customize the symbols, line styles, and colors assigned |
| to data points in |
| Settings, page |
|
|
Show threshold line | Draws a horizontal line on the Received Utilization Chart, indicating the |
for: | receive threshold for the selected link. |
| If you do not want to draw a threshold line, select None. This is the default |
| setting. |
|
|
Scale to threshold | Scales the Received Utilization Chart in order to draw the threshold selected |
| in the Show threshold line for field: |
| • To scale the chart, select this checkbox. |
| • To remove the scaling from the chart, clear this checkbox. This is the |
| default setting. |
| The Scale to threshold checkbox is not available if the Show threshold line |
| for: field is set to None. |
|
|
Reset | If you scrolled or zoomed the chart, resets the chart to the default view and |
| scaling. |
|
|
Grid On | Superimposes a graphic grid on the chart. The grid can make the data easier |
| to read. |
|
|
Grid Off | Removes the graphic grid from the chart. |
|
|
Help | Displays online help for the current window. |
|
|
|
| Cisco Signaling Gateway Manager User Guide |
|
|
|
|
| ||
|
|
| ||
|
|
|
