Chapter 8 Working with Linksets
Viewing
SendUtilization
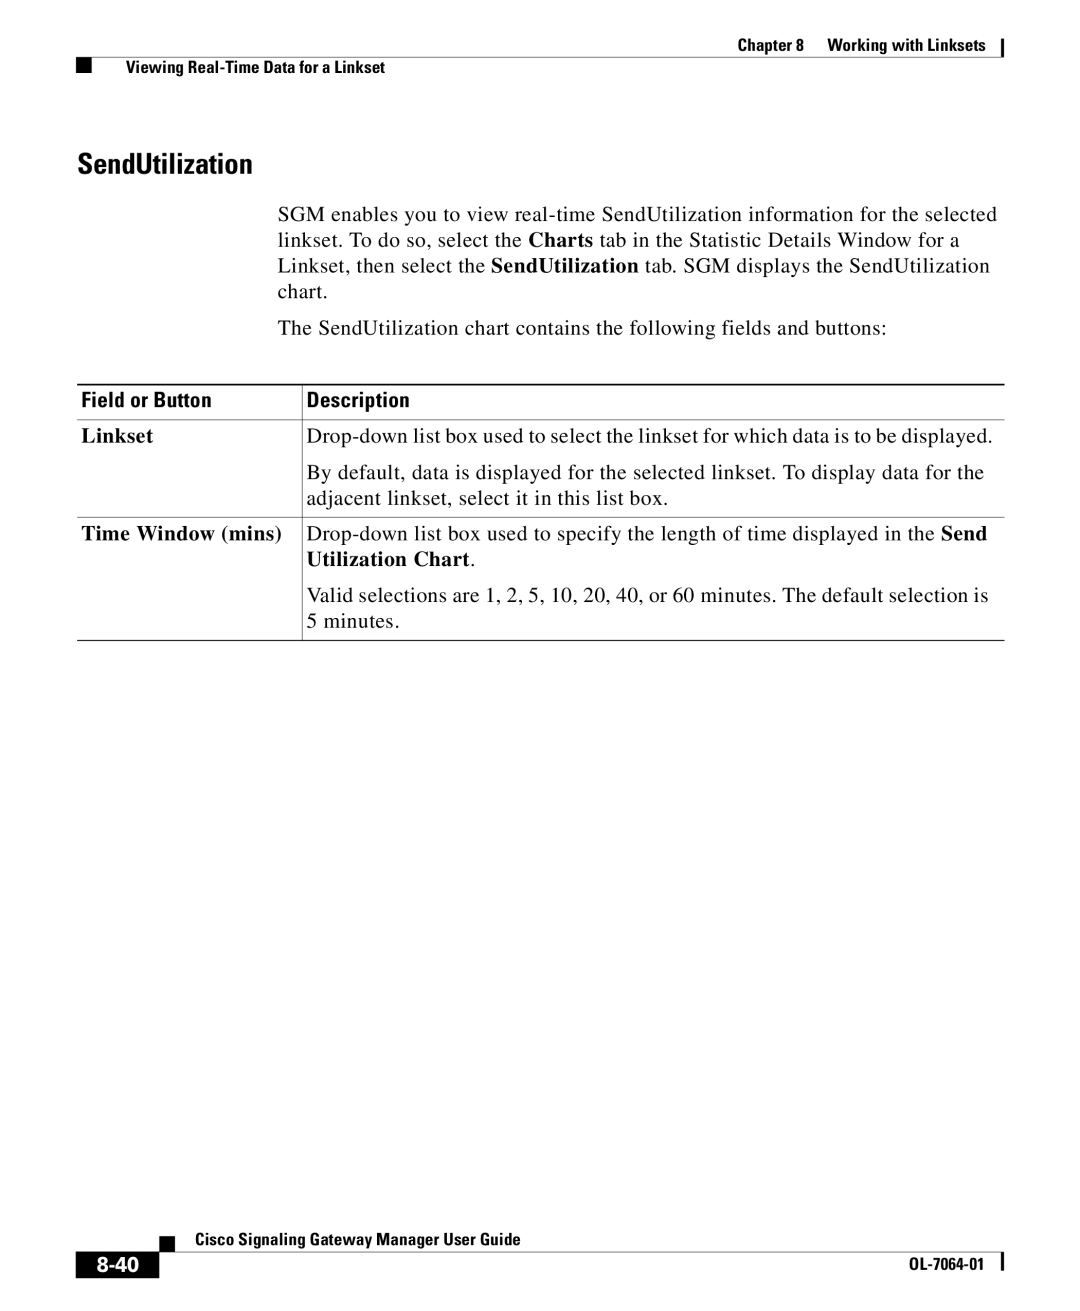
| SGM enables you to view | |
| linkset. To do so, select the Charts tab in the Statistic Details Window for a | |
| Linkset, then select the SendUtilization tab. SGM displays the SendUtilization | |
| chart. | |
| The SendUtilization chart contains the following fields and buttons: | |
|
|
|
Field or Button |
| Description |
|
|
|
Linkset |
| |
|
| By default, data is displayed for the selected linkset. To display data for the |
|
| adjacent linkset, select it in this list box. |
|
| |
Time Window (mins) | ||
|
| Utilization Chart. |
|
| Valid selections are 1, 2, 5, 10, 20, 40, or 60 minutes. The default selection is |
|
| 5 minutes. |
|
|
|
| Cisco Signaling Gateway Manager User Guide |