MON 20/20
MON 20/20 Software for Gas Chromatographs
Warranty
Important Instructions
This page is intentionally left blank
Table of Contents
Using the hardware functions
Using the Application functions
Section Logs and reports
Section Controlling Analyses
Section Using MON 20/20 Tools
Appendix a Component Data Table Appendix B Data computations
Getting started
MON20/20 Software for Gas Chromatographs
What’s new in MON 20/20
MON20/20 Software for Gas Chromatographs
MON20/20 Software for Gas Chromatographs
System requirements
Getting started with MON 20/20
Launching MON 20/20
Installing MON 20/20
Registering MON 20/20
Register MON 20/20 window,
Select Program Settings... from the File menu
Setting up the data folder
GC directory file not found message
Configuring MON 20/20 to connect to a gas chromatograph
GC directory window
MON20/20 Software for Gas Chromatographs
Export GC Directory
Importing or exporting the GC directory table
GC directory file not found message
Launching MON 20/20 from the SNAP-ON for DeltaV
10.The Device Connection View
11.Right-click to view context menu
Launching MON 20/20 from the AMS Device Manager
12.Device Explorer
13.Right-click to view the context menu
MON 20/20 user interface
14.Features of the MON 20/20 main window
Main user interface
Function of the shortcut icons on the Toolbar
MON20/20 Software for Gas Chromatographs
GC Status Bar
Connecting to a gas chromatograph
18.The Connect to GC window
Login dialog appears
Disconnecting from a gas chromatograph
Keyboard commands
You can use the following function keys from the main window
Task or Data Item Sections Menu Path Keystroke
Procedures guide
Task or Data Item Sections Menu Path Keystroke
MON20/20 Software for Gas Chromatographs
Editing a configuration file
Configuring a gas chromatograph
21.MON 20/20 in offline edit mode
Importing a configuration file
Saving a gas chromatograph’s current configuration
22.Restore to Factory Settings warning message
Restoring the GC to its factory settings
Configuring your printer
Operating modes for MON 20/20
Using online help
Viewing the Physical Name column
Select the Show Physical Names checkbox
26.The Heater window showing Physical Name column
Selecting the GC’s networking protocol
27.The Program Settings window
28.Example of a context-sensitive variable selector
Using the context-sensitive variable selector
30.Third-level drop-down list
32.Variable selected
Viewing chromatograms
Using the chromatograph functions
Chromatogram window
Data displayed in the chromatogram window
Select Chromatogram Viewer... from the Chromatograph menu
Viewing a live chromatogram
View Current CGM
Chromatogram Viewer
Viewing an archived chromatogram
October
Click GC Archive. The Select archive files window appears
Select window
Chromatogram Viewer displaying an archived chromatogram
Protecting or unprotecting an archived chromatogram
Select archive files window
Edit Description window
10.The Select archive files window
11.The Select window
Viewing a saved chromatogram
12.The Chromatogram Viewer displaying a saved chromatogram
Working with the graph
Command Name Shortcut Description
Graph bar
Editing the display properties of the chromatograph
Following table lists the parameters that can be edited
14.A chromatogram
Command Description
Additional plot commands
Mini-plot window
Editing a chromatogram trace
Working with a chromatogram
Click Edit. The Edit Chromatogram dialog appears
18.Chromatogram pull-down menu
Viewing chromatogram results
19.The results window
20.Chromatogram pull-down menu
Saving a chromatogram trace
22.Chromatogram pull-down menu
Removing a chromatogram trace from view
23.Chromatogram pull-down menu
Forcing a calibration
MON20/20 Software for Gas Chromatographs
25.Chromatogram pull-down menu
Opening a comparison file
Saving a comparison file
27.Miscellaneous options
Miscellaneous commands
Name Description
Working with the Timed Events table
Editing Timed Events from the Chromatogram Viewer
Editing Timed Events from the Time Events window
These options are only avialable while in edit mode
Cursor coordinates
MON20/20 Software for Gas Chromatographs
Working with the Component Data Table
Viewing raw data
Editing retention times from the Chromatogram Viewer
Following data displays for each peak from the trace
Setting the gas chromatograph’s date and time
31.The View/Set Date Time window
32.The View/Set Date Time window
Adjusting daylight savings
MON20/20 Software for Gas Chromatographs
MON20/20 Software for Gas Chromatographs
Using the hardware functions
Heaters window
Renaming a heater
Setting the heater’s type
Monitoring the temperature of a heater
Monitoring the operational status of a heater
Setting the desired temperature
Setting PWM Output
Heaters window
Removing a heater from service
Renaming a valve
Configuring the valves
Type in a new descriptive name for the valve Click OK
Valves window
Setting a valve’s operational mode
10.The Valves window
Monitoring the operational status of a valve
11.The Valves window
Inverting the polarity of a valve
12.The Valves window
Setting the usage mode for a valve
MON20/20 Software for Gas Chromatographs
Controlling the detectors
Following data displays for each detector
Offsetting the baseline
14.The Detectors window
Igniting the FID flame
Balancing the preamp
Resetting the preamp value
15.The Detectors window
Renaming a discrete input
Managing your gas chromatograph’s discrete inputs
16.The Discrete Inputs window
Setting a discrete input’s operational mode
To set a discrete input’s operational mode, do the following
18.The Discrete Inputs window
Monitoring the operational status of a discrete input
19.The Discrete Inputs window
Inverting the polarity of a discrete input
Renaming a discrete output
Managing your gas chromatograph’s discrete outputs
Setting a discrete output’s operational mode
21.The Discrete Outputs window
22.The Discrete Outputs window
Monitoring the operational status of a discrete output
23.The Discrete Outputs window
Setting the usage mode for a discrete output
Managing your gas chromatograph’s analog inputs
24.The Analog Inputs window
Renaming an analog input
25.The Analog Inputs window
Setting a analog input’s operational mode
Setting the type of analog input signal
Setting the scale values for an analog input device
27.The Analog Inputs window
28.The Analog Inputs window
Monitoring the status of an analog input
29.The Analog Inputs window
Calibrating an analog input
Click Next. of the Analog Input Calibration Wizard displays
Click Finish. The calibration is complete
Renaming an analog output
Managing your gas chromatograph’s analog outputs
35.The Analog Outputs window
Setting a analog output’s operational mode
36.The Analog Outputs window
Setting the scale values for an analog output device
37.The Analog Outputs window
Mapping a system variable to an analog output
38.The Analog Outputs window with Variable drop-down menu
Monitoring the status of an analog output
40.The Analog Outputs window
Calibrating an analog output
41.The Analog Output Calibration Wizard
43. of the Analog Output Calibration Wizard
44. of the Analog Output Calibration Wizard
Reviewing the Hardware Inventory List
45.The Installed Hardware window
MON20/20 Software for Gas Chromatographs
This page is intentionally left blank
Using the Application functions
System window
Managing the system
Field Name Description
Hhmmss
Managing Component Data Tables
Selected component data table
Editing a Component Data Table
Parameter Description
MON20/20 Software for Gas Chromatographs
MON20/20 Software for Gas Chromatographs
Adding a component to a Component Data Table
Selected component data table
Removing a component from a Component Data Table
Viewing the standard values for a component
Selected component data table
Click Close
11.The Select dialog
Following data displays for each peak
Managing timed events
MON20/20 Software for Gas Chromatographs
14.The Timed Events window
Editing valve events
16.The Timed Events window
Editing integration events
17.The Timed Events Tables selector window
18.The Timed Events window
Has a slight slope. Default
Editing spectrum gain events
19.The Timed Events Tables selector window
20.The Timed Events window
Setting the cycle and analysis time
MON20/20 Software for Gas Chromatographs
Removing an event from the Timed Event Table
MON20/20 Software for Gas Chromatographs
Adding an event to the Timed Event Table
26.The Timed Events window
27.The Validation Data window
Managing Validation Data Tables
28.No components warning
Managing calculations
Setting standard calculations by stream
29.The Control Calculations window
Editing average calculations
30.The Averages Calculations window
Custom Hours setting overrides the Reset Time setting
31.The Averages Calculations window
Viewing an archive of averages for a given variable
32.The archive data window
33.The Averages Calculations window
Copying stream settings
34.No streams available warning
Copying component settings
35.The Averages Calculations window
36.No components available warning
Creating Custom Calculations
Click Edit. The Edit User-defined Calculation window appears
38.The Edit User-defined Calculation window
Click Delete Line to delete the selected line
39.Expression Editor No Action
43.Calculator functions
This section contains the following keys
Inserting a Comment
44.Edit Comment mode
46.An example of a conditional statement
Inserting a Conditional Statement
48.Edit Expression area
49.the Variable/Constant drop-down list
Variable = Regular expression
Inserting an Expression
52.The Final Result tree view
54.The Calculation Steps Viewer
Creating a Constant
55.The Edit Constants window
56.The Edit Temporary Variables window
Creating or Editing a Temporary Variable
57.The Expression Editor
Inserting a System Variable
58.System Variables drop-down menu
Using User-defined Calculations
59.The Expression Editor
GPA ISO GPA & ISO
Setting the calculation method
PSI
Setting alarm limits
61.The Limit Alarms window
62.No streams available warning
63.No components available warning
Managing system alarms
64.The Limit Alarms window
Designating how a stream will be used
Managing streams
65.The Streams window
66.The Streams window
67.The Streams window
Assigning a data table to a particular stream
Changing the base pressure for a stream
Creating a stream sequence for a detector
69.The Stream Sequence window
Communications
Metric
Creating or editing registers
To map GC data to Modbus registers, do the following
72.The Modbus Map Editor window
Rdwr
73.Conflicting registers warning
75.The Communication window
Creating a new map file
76.The Modbus Map Editor window
77.The Modbus Map Editor window
78.The Open window
Than Float require only one register per variable
80.Conflicting registers warning
Viewing or editing scales
Assigning a variable to a register
82.The Edit Scales window
To edit or create your own scale, do the following
Following table describes the ethernet ports’ parameters
Configuring the gas chromatograph’s Ethernet port
85.The LOI Status Variables window
Working with local operator interface variables
MON20/20 Software for Gas Chromatographs
86.The FFB PV Mappings window
Mapping Foundation Fieldbus variables
MON20/20 Software for Gas Chromatographs
100
Logs and reports
Viewing and clearing alarms
Viewing unacknowledged and active alarms
Acknowledging and clearing alarms
Viewing the alarm log
Alarm Log window supplies the following data for each alarm
To view a list of alarms, do the following
Maintenance Log window
Viewing the maintenance log
Adding an Entry to the Maintenance Log
Deleting an entry from the maintenance log
Viewing and editing the parameter list
Working with the parameter list
Parameter List window
Parameter List window
Importing and exporting the parameter list
Tiff
Working with drawings and documents
Drawings/Documents window
Select the drawing to view from the drop-down list
Viewing drawings or documents
11.The File Viewer
12.The Drawings/Documents window
Adding files to the GC
13.The Drawings/Documents window
Deleting files from the GC
14.The Event Log window
Viewing the event log
To view the list of change events, do the following
15. The Event Log
Understanding report types
Displaying reports
MON20/20 Software for Gas Chromatographs
MON20/20 Software for Gas Chromatographs
16.Analysis GPA sample report
17.Analysis ISO sample report
18.Calibration sample report
19.Final Calibration sample report
20.Validation sample report
21.Final Validation sample report
22.RawData sample report
Viewing reports from live data
MON20/20 Software for Gas Chromatographs
24.The report window
25.The Report Display window
Viewing a saved report
TXT RPT HTM Html MHT
Viewing reports based on archived data
27.The Analysis/Calibration Archive Report window
28.The Analysis/Calibration Archive Report window
29.The report window
Viewing average reports based on archived data
30.The Analysis/Calibration Archive Report window
TXT HTM Html MHT
Printing reports automatically
MON20/20 Software for Gas Chromatographs
Viewing live trend data
Viewing trend data
Click Trend. The Select records for Trending window displays
33.The Select records for Trending window
34.The Trend Data window with graphs
35.The Trend Data window
Viewing saved trend data
36.The Trend Data window
Working with the Trend Graph
Command Name Shortcut Description
Ctrl + F9
37. The graph
Editing the display properties of the graph
38.The Edit Graph window
Command Description Default Value
39. Primary axes
40. The Trend bar
Working with a trend graph
41.The Trend pull-down menu
Editing a trend graph
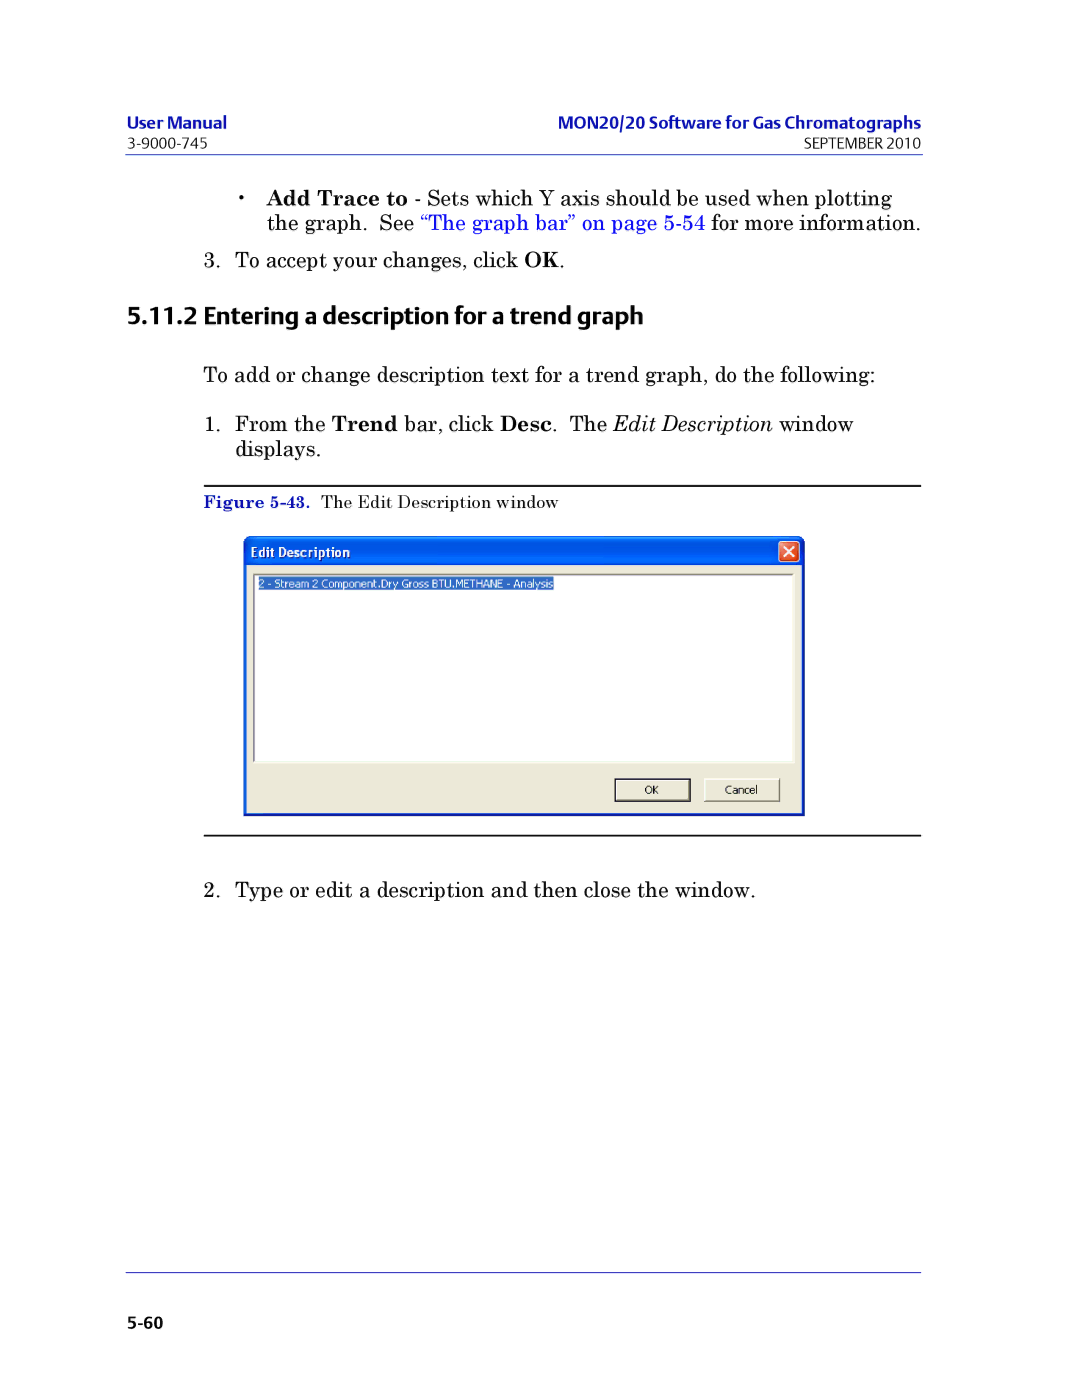
43.The Edit Description window
Entering a description for a trend graph
44.The Trend pull-down menu
Saving a trend trace
Displaying trend data
Removing a trend graph from view
Table contains the following columns
47.The Trend Data window
48.The GC Config Report window
Generating a GC Configuration Report
Select the type of output you want for the report
Sample
Sample
H2S
Pentane Area Cal 4017.9700 3715.5801
Sample
Slope Sens Peak Width Inhibit
TEV Type
Inhibit 13.0 13.5
Kg/m3 Calculation
Label Cal Freq Start Time
Alarm High 12.19999981
Alarm High Label
Alarm False MSGSWITCH3Out of Range4Intern Al Error
CDT TEV
Analog Output
Invert Start Time Duration
SCALEDFP10
SCALEDFP11
BTU
Float Rdwr
Home/Daniel/ReportTemplates/DefaultAnalysisReport.xml
Deleting archived data from the gas chromatograph
49.The Reset Archive Data window
Molecular weight vs. response factor graph
50.Molecular Weight vs. Response Factor window
This page is intentionally left blank
MON20/20 Software for Gas Chromatographs
Halting an analysis
Controlling Analyses
Confirmation message
Auto sequencing
Select Auto Sequence... from the Control menu
Analyzing a single stream
Calibrating the gas chromatograph
Start Calibration window
Validating the Gas Chromatograph
10.The Start Validation window
Click Yes and the current analysis stops
Stopping an Analysis Run
This page is intentionally left blank
Using the Modbus Test program
Using MON 20/20 Tools
SIM2251 UserModbus
Comparing Modbus protocols
Setting communication parameters
Click Port Setup. The Port Setup window appears
Getting Modbus Data
Type the starting register value in the Data Addr field
Transmitting using a single data type
Type the starting register value in the Data Addr field
Register Range Default Type
Transmitting using a template
Type the starting register value in the Data Addr field
Data Type Setting Other Settings Result
Setting the log parameters
Log Data window
Saving Modbus data
Troubleshooting communication errors
Printing Modbus data
Assigning scale ranges to UserModbus registers
Click Error.... The Error window appears
Managing users
Menu Commands Admin Super Regular Read-Only User
Menu Commands Admin Super Regular Read-Only User
Creating users
User Administration window
Add User window
Exporting a list of user profiles
Click Export File. The Export User File window displays
Export User File window
Importing a list of user profiles
Click Import File. The Import User File window displays
Navigate to where the file is located, if necessary
Editing users
12.The User Administration window
13.The Edit User window
Removing a user
14.The User Administration window
Changing a user’s password
15.The Change User Password window
Resetting the adminstrator password
Click Yes. The Connect to GC window displays
18.The MON 20/20 Password Reset window
Finding out who is connected to the gas chromatograph
Upgrading the firmware
21.The Upgrade Firmware window
MON20/20 Software for Gas Chromatographs
Viewing diagnostics
Cold booting
23.The Diagnostics window
24.The LOI Key Sensitivity window
Adjusting the sensitivity of the LOI Keys
25.The Roc Cards window
Setting the ROC card type
MON20/20 Software for Gas Chromatographs
MON20/20 Software for Gas Chromatographs
Appendix A, Component Data Table
Mol
Component Name Vapor Gas Liquid
NO2
Octane Oxygen
Table A-2 ISO Component Data Table
HCL
NO2
MON
This page is intentionally left blank
Data acquisition
Appendix B, Data computations
Peak detection
Analysis computations
Calibration
Concentration analysis with response factor
Calculation in mole percent w/o normalization
Liquid equivalent computations
Post analysis computations
Drybtu
Heating value calculations
Corrdrybtu =
CorrDryBTU = ⎛ DryBTUatBasePressure ⎞ ⎛ ContractPressure ⎞
Corrgrossbtu
∑ Conc i VP
∑ LVpercentiLRDi
ResponseFactor = AP 3 + bP 2 + cP + d
Multi-level calibration
Indirect calibration
UserModbus register list
Appendix C, Modbus registers list
Table C-2 List of UserModbus Registers
DET1
MON20/20 Software for Gas Chromatographs
MON20/20 Software for Gas Chromatographs
MON20/20 Software for Gas Chromatographs
Reg. No Description
SIM2251 Modbus register list
MON20/20 Software for Gas Chromatographs
Modbus registers list
3056
Reg. No Description
MON20/20 Software for Gas Chromatographs
October
Reg
9000-745
MON20/20 Software for Gas Chromatographs
GPA system variables
Appendix D, Basic and advanced system variables
System Reference Manual 700XA Gas Chromatograph
700XA Gas Chromatograph System Reference Manual
System Reference Manual 700XA Gas Chromatograph
700XA Gas Chromatograph System Reference Manual
System Reference Manual 700XA Gas Chromatograph
700XA Gas Chromatograph System Reference Manual
System Reference Manual 700XA Gas Chromatograph
TEV
ISO system variables
700XA Gas Chromatograph System Reference Manual
System Reference Manual 700XA Gas Chromatograph
700XA Gas Chromatograph System Reference Manual
System Reference Manual 700XA Gas Chromatograph
700XA Gas Chromatograph System Reference Manual
Application Streams Usage
This page is intentionally left blank
700XA Gas Chromatograph
Appendix E, Creating custom calculations
Figure E-2.The Edit User-defined Calculation window
Click Delete Line to delete the selected line
Being performed
Figure E-7.Calculator functions
This section contains the following keys
Inserting a comment
Figure E-8.Edit Comment mode
Figure E-10.An example of a conditional statement
Inserting a conditional statement
Figure E-12.Edit Expression area
Figure E-13.the Variable/Constant drop-down list
Inserting an expression
Figure E-15.Edit Expression area
Figure E-17.The Edit Expression area
Figure E-19.The Edit Constants window
Creating a constant
Figure E-20.The Edit Temporary Variables window
Creating or editing a temporary variable
Inserting a system variable
Figure E-21.The Expression Editor
Using user-defined calculations
Figure E-22.System Variables drop-down menu
Figure E-23.The Expression Editor
MON20/20 Software for Gas Chromatographs
Warranty Claim Procedures
This page is intentionally left blank
Customer Repair Report
Page
This page is intentionally left blank