McDATA Web Server Fabric tree
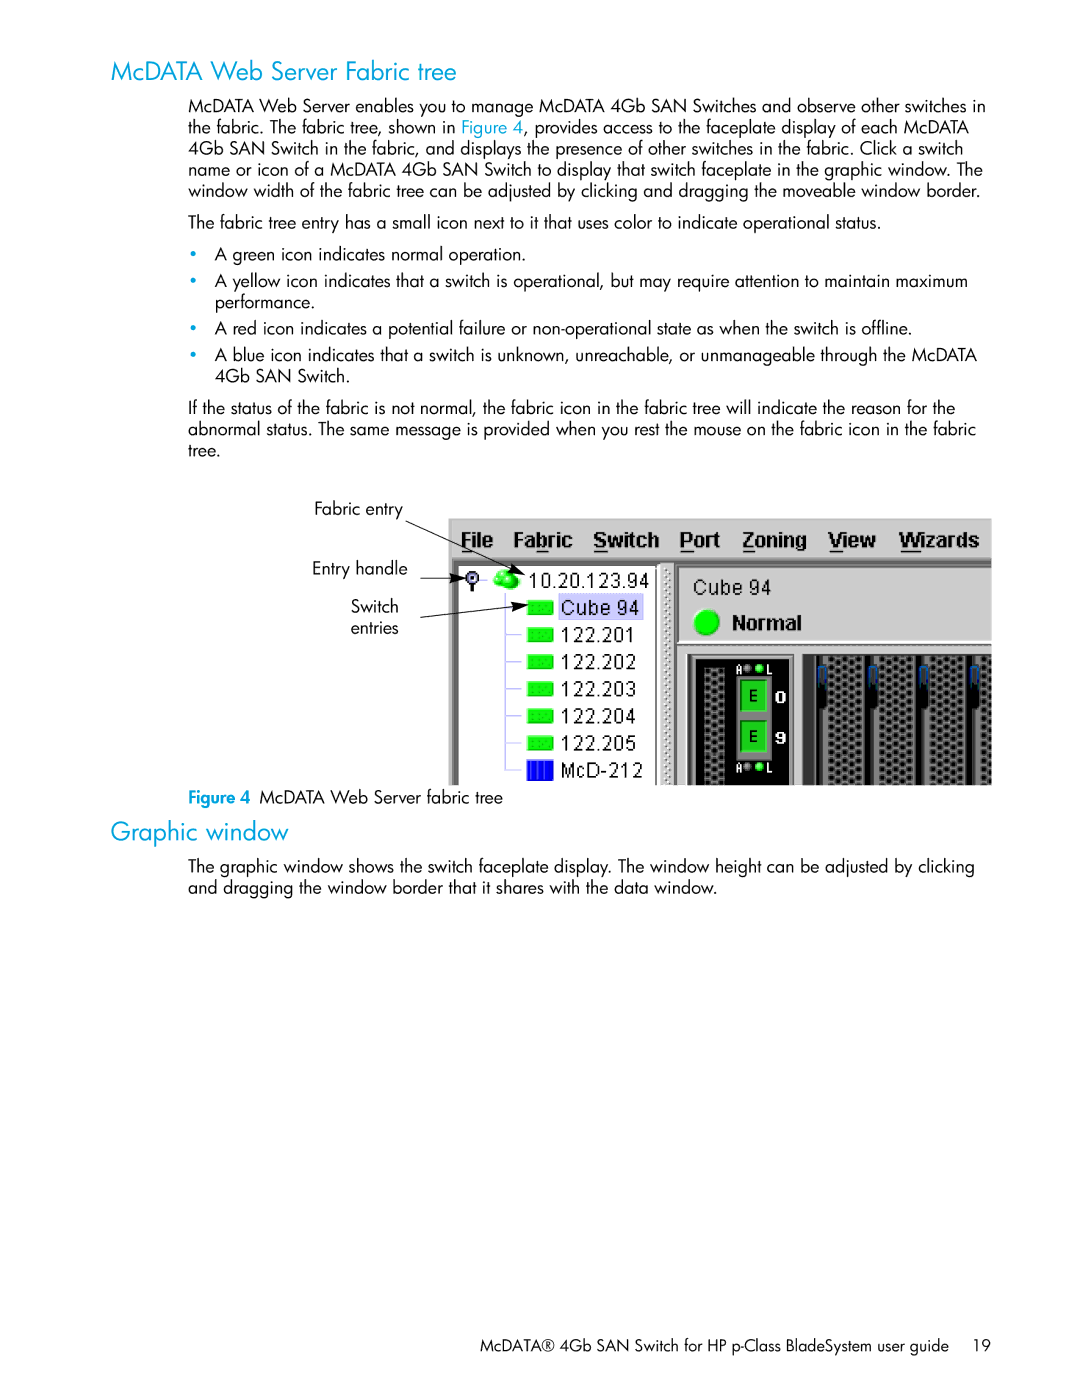
McDATA Web Server enables you to manage McDATA 4Gb SAN Switches and observe other switches in the fabric. The fabric tree, shown in Figure 4, provides access to the faceplate display of each McDATA 4Gb SAN Switch in the fabric, and displays the presence of other switches in the fabric. Click a switch name or icon of a McDATA 4Gb SAN Switch to display that switch faceplate in the graphic window. The window width of the fabric tree can be adjusted by clicking and dragging the moveable window border.
The fabric tree entry has a small icon next to it that uses color to indicate operational status.
•A green icon indicates normal operation.
•A yellow icon indicates that a switch is operational, but may require attention to maintain maximum performance.
•A red icon indicates a potential failure or
•A blue icon indicates that a switch is unknown, unreachable, or unmanageable through the McDATA 4Gb SAN Switch.
If the status of the fabric is not normal, the fabric icon in the fabric tree will indicate the reason for the abnormal status. The same message is provided when you rest the mouse on the fabric icon in the fabric tree.
Fabric entry
Entry handle![]()
![]()
Switch entries
Figure 4 McDATA Web Server fabric tree
Graphic window
The graphic window shows the switch faceplate display. The window height can be adjusted by clicking and dragging the window border that it shares with the data window.
McDATA® 4Gb SAN Switch for HP