mpstat
Table B-1 Performance Analysis Tools
Category | Type | Name | Parameters | Usage |
|
|
|
|
|
|
|
|
| Socket connection |
|
|
|
| count |
| Portal Server on App | verbose:gc |
| Garbage collection |
| Server container |
|
|
|
Tuning | Solaris 8 and Solaris 9 | /etc/system | Various | Performance |
Parameters |
|
|
|
|
|
| /etc/rc2.d/ttuni | Various | TCP kernel tuning |
|
| ng parameters file |
| parameters |
|
|
|
|
|
mpstat
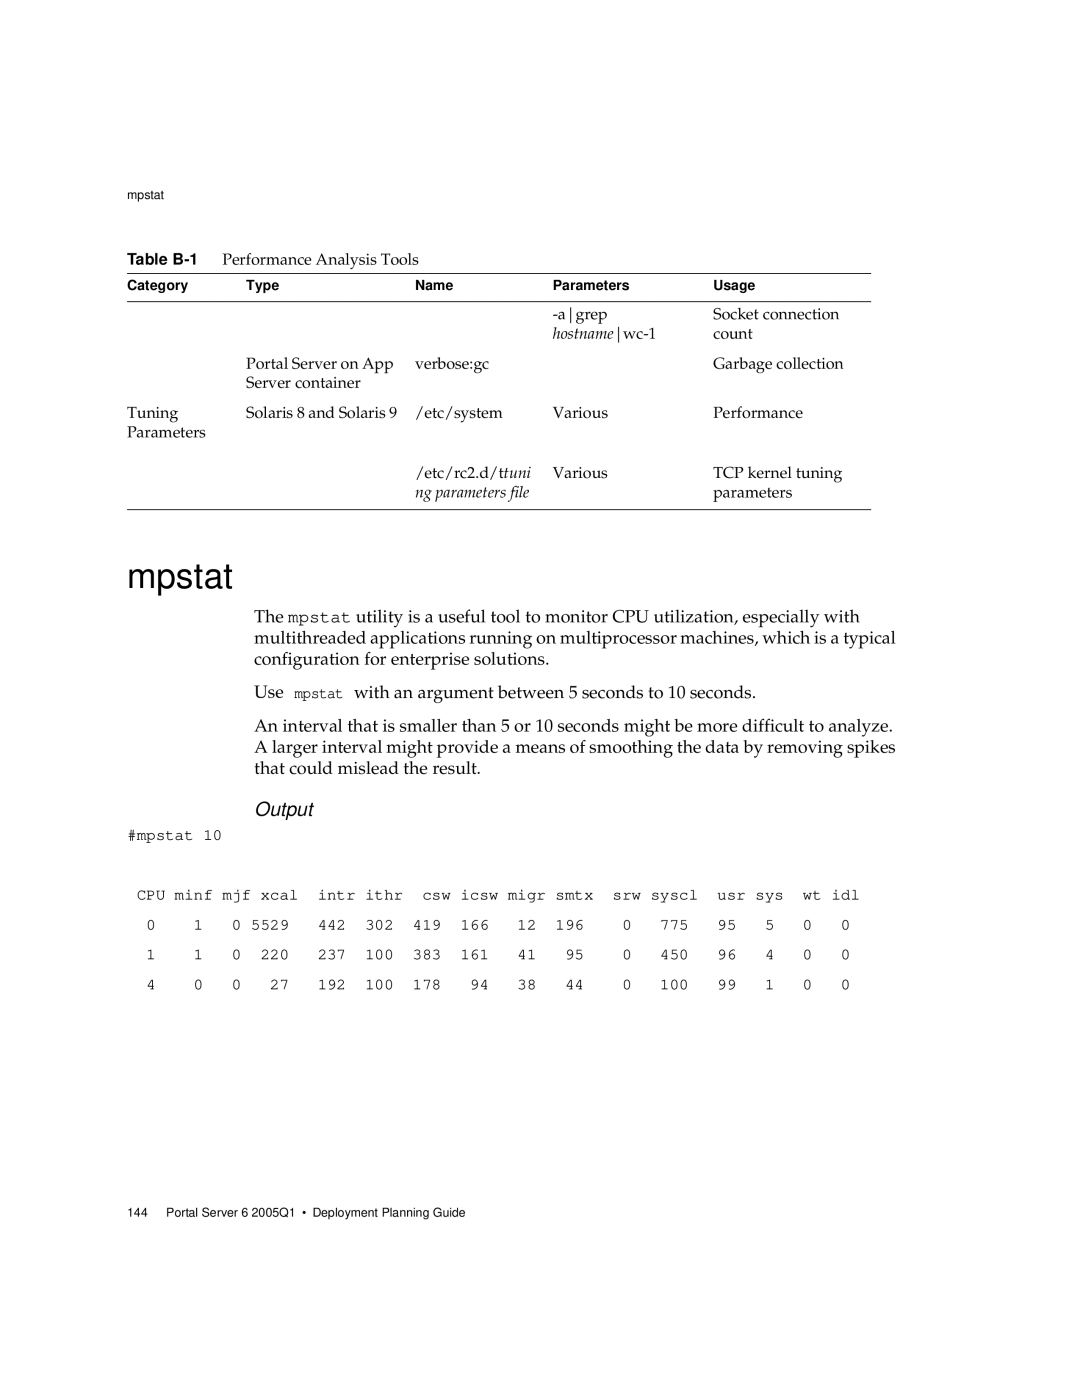
The mpstat utility is a useful tool to monitor CPU utilization, especially with multithreaded applications running on multiprocessor machines, which is a typical configuration for enterprise solutions.
Use mpstat with an argument between 5 seconds to 10 seconds.
An interval that is smaller than 5 or 10 seconds might be more difficult to analyze. A larger interval might provide a means of smoothing the data by removing spikes that could mislead the result.
Output
#mpstat 10
CPU minf mjf | xcal | intr | ithr | csw | icsw migr | smtx | srw syscl | usr sys | wt idl | ||||||
0 | 1 | 0 | 5529 | 442 | 302 | 419 | 166 | 12 | 196 | 0 | 775 | 95 | 5 | 0 | 0 |
1 | 1 | 0 | 220 | 237 | 100 | 383 | 161 | 41 | 95 | 0 | 450 | 96 | 4 | 0 | 0 |
4 | 0 | 0 | 27 | 192 | 100 | 178 | 94 | 38 | 44 | 0 | 100 | 99 | 1 | 0 | 0 |