Agilent 86120C Multi-Wavelength Meter User’s Guide
Second Edition 86120-90C03 August
Agilent 86120C-At a Glance
Characterize laser lines easily
Print measurement results
Program the instrument for automatic measurements
Measurement accuracy-it’s up to you
General Safety Considerations
There is no output laser aperture
WA R N I N G
Viii
Contents
Performance Tests
Contents-3
Page
Getting Started
Getting Started
Measurement accuracy-it’s up to you
Inspect the Shipment
Connect the Line- Power Cable
Line Power Requirements
Connect a Printer
Turn on the Agilent 86120C
Instrument firmware version
Enter Your Elevation
Converting feet to meters
Select Medium for Wavelength Values
Definition of standard air
Turn Off Wavelength Limiting
Returning the Instrument for Service
Preparing the instrument for shipping
Returning the Instrument for Service
Returning the Instrument for Service
Returning the Instrument for Service
Page
Making Measurements
Making Measurements
Measuring Wavelength and Power
This section includes
Peak WL mode
To display peak wavelength and power
Measuring Wavelength and Power
List by WL or Power modes
To display multiple laser lines
Total power and average wavelength
Limiting the wavelength measurement range
To display average wavelength and total power
To limit the wavelength range
Measuring broadband devices and chirped lasers
To measure broadband devices
To see the graphical display
Graphical display of optical power spectrum
Agilent 86120C graphical display
Power bar
To control the power bar
Instrument states
To save an instrument state
Changing the Units and Measurement Rate
Displayed units
To change the units of measure
Available Units
Measurement rate
To change the measurement speed
Continuous or single measurements
To select single measurement acquisition
Defining Laser- Line Peaks
To define laser- line peaks
If too many lines are identified
Measuring Laser Separation
Channel separation
To measure channel separation
Measuring flatness
To measure flatness
Measuring Laser Drift
To measure drift
If measurement updating stops or the values become blanked
Measuring Laser Drift
Measuring Signal- to- Noise Ratios
Signal-to-noise display
Location of noise measurements
Automatic interpolation
Repetitive data formats
To measure signal- to- noise
Measuring Signal- to- Noise Ratios with Averaging
Signal-to-noise with averaging display
To measure signal- to- noise with averaging
Press List by WL or List by Power
Measuring Fabry- Perot FP Lasers
To characterize a Fabry- Perot laser
P
PWR
Measuring Modulated Lasers
Prbs modulation graph showing raised noise floor
Measuring Total Power Greater than 10 dBm
To measure total power exceeding 10 dBm
Calibrating Measurements
To enter the elevation
To select the medium for light
Printing Measurement Results
To create a hardcopy
Cleaning Connections for Accurate Measurements
Choosing the Right Connector
Basic components of a connector
Universal adapters to Diamond HMS-10
Inspecting Connectors
Clean, problem-free fiber end and ferrule
Damage from improper cleaning
Measuring insertion loss and return loss
Cleaning Connectors
Visual inspection of fiber ends
Cleaning Accessories
To clean a non- lensed connector
Dust Caps Provided with Lightwave Instruments
To clean an adapter
Universal adapters
Cleaning Connections for Accurate Measurements
Programming
Where to begin…
Types of commands
Addressing and Initializing the Instrument
Remote mode and front- panel lockout
Initialize the instrument at start of every program
Set single acquisition mode
To change the Gpib address
Making Measurements
Making Measurements
Commands are grouped in subsystems
Unit
Commands for Capturing Data
Measurement instructions give quick results
MEASure command
Different Forms of MEASure
Read command
FETCh command
CONFigure command
Return single or multiple measurement values
ARRay and the Scpi standard
Or, the *WAI command could be used
Measure delta, drift, and signal- to- noise
Format of returned data
Measurements are returned as strings
Determine the number of data points
Data can be corrected for elevation and vacuum
Monitoring the Instrument
Status registers
Status Byte register
Monitoring the Instrument
OPERation Status and QUEStionable Status registers
Bits in Operation Status Register
Bits in Questionable Status Register
Standard Event Status register
Enabling register bits with masks
Queues
Error queue
Output queue
Scpi command are grouped in subsystems
Sending a command
Reviewing Scpi Syntax Rules
Use either short or long forms
Combine commands in the same subsystem
Examples of Short Forms
Equivalent Short Form
You can use upper or lowercase letters
Combine commands from different subsystems
Sending common commands
Adding parameters to a command
White space
28E2 280E-1 28000m 028K 28E-3K
Suffix Multipliers
Program message terminator
Querying data
Errormsg subroutine
Example Programs
Many subroutines are repeated in the examples
Setese subroutine
FNIdentity function
Errmngmt subroutine
Cmdopc subroutine
Tempo subroutine
OFF Timeout
Example 1. Measure a DFB laser
Fnend
Example 2. Measure WDM channels
COM /Instrument/ @Mwm Output @Mwm *ESEIVAL00110100,2
Example 3. Measure WDM channel drift
Query the number of data points
Turn off drift reference state
CmdopcSUB CmdopcSetcmd$
Example 4. Measure WDM channel separation
Query number of data points
Next
Turn signal-to-noise ratio on
Next Stop
Example 6. Increase a source’s wavelength accuracy
Set wavelength of tunable laser source
Lists of Commands
10. Programming Commands 1
10. Programming Commands 2
10. Programming Commands 3
10. Programming Commands 4
Frequency DISPlayMARKerMAXimumNEXT
AIR SENSeDATA?
11. Keys Versus Commands 1
∆ WL
11. Keys Versus Commands 2
Lists of Commands
Programming Commands
Programming Commands
12. Notation Conventions and Definitions
Common Commands
CLS
Query Response
13. Event Status Enable Register
Example
ESR?
14. Standard Event Status Register
IDN?
OPC
15. Conditions Set by *RST Reset 1
RST
15. Conditions Set by *RST Reset 2
SAV
16. Service Request Enable Register
SRE
Integer from 0 to 63 or from 128 to
STB?
17. Status Byte Register
TRG
WAI
Measurement Instructions
POWer? FREQuency? WAVelength? WNUMber?
MEASureARRay SCALar POWer?
CONFigure command
Displays the highest power signal
MINimum Displays the lowest power signal DEFault
88346500E+000
MEASureARRay SCALar POWerFREQuen- cy?
MINimum
MAXimum Resolution fast update
DEFault Current marker position
MINimum Resolution normal DEFault Current resolution
MEASureARRay SCALar POWerWAVe- length?
MEASSCALPOWWAV? MAX is sent
MEASureARRay SCALar POWerWNUMber?
If the MEASSCALPOWWNUM? 6451 command is sent, and a
CALCulate1 Subsystem
FREQuency POINts
DATA?
Frequency = 181,6915 THz + 2, 9993,613378 GHz = 192,5280 THz
CALCulate1 Subsystem
Non-sequential command
TRANsformFREQuencyPOINts
Constant Description MINimum 525 MAXimum 15,047
3-12 for more information
For normal update
CALCulate2 Subsystem
STATe
STATe STARt FREQuency WAVelength WNUMber
FREQuency WAVelength WNUMber
POWer
Weighted average wave number is returned
Constant Description FREQuency
Average frequency is returned
PEXCursion
Syntax
Attribute
Summary
PTHReshold
POINts?
Constant Value MINimum MAXimum 40 dB
DEFault 10 dB
PWAVerageSTATe
CALCulate2 Subsystem
WLIMitSTATe
WLIMitSTARtFREQuency
3-12for more information
WLIMitSTARtWAVelength
WLIMitSTARtWNUMber
WLIMitSTOPFREQuency
WLIMitSTOPWAVelength
WLIMitSTOPWNUMber
CALCulate3 Subsystem
DIFFerence STATe MAXimum MINimum PRESet REFerence
CLEar COUNt STATe
WAVelength? FREQuency? WNUMber?
WAVelength? FREQuency? WNUMber? POWer? SIGMa
REFerence FREQuency WAVelength WNUMber STATe
ASNRCLEar
ASNRCOUNt
Constant Description MINimum MAXimum 900
ASNRSTATe
Tion on selecting measurements
Completed
Argument Description POWer
Is completed
DELTaPOWerSTATe
DELTaPRESet
DELTaREFerenceFREQuency
DELTaREFerencePOWer?
Constant
DELTaREFerenceWAVelength
DELTaREFerenceWNUMber
Measurement
DELTaWAVelengthSTATe
An absolute frequency unnormalized
DELTaWPOWerSTATe
DRIFtDIFFerenceSTATe
Imum power and frequency
DRIFtMAXimumSTATe
Imum power or frequency
DRIFtMINimumSTATe
DRIFtPRESet
DRIFtREFerenceRESet
DRIFtREFerenceSTATe
DRIFtSTATe
FPERotSTATE
FPERotFWHM?
Argument Description WAVelength
Modes
FPERotMEAN?
FPERotMODESPACing?
FPERotPEAK?
Watts
FPERotPOWer?
Argument Description
DBm DBM
Watts WATTs
FPERotSIGMa?
PRESet
Snrauto
Selects user-entered reference frequency
SNRREFerenceFREQuency
SNRREFerenceWAVelength
SNRREFerenceWNUMber
SNRSTATe
CONFigure Measurement Instruction
PREVious RIGHt
DISPlay Subsystem
GRAPhics STATe
MARKerMAXimum
MARKerMAXimumLEFT
MARKerMAXimumNEXT
MARKerMAXimumPREVious
MARKerMAXimumRIGHt
WINDowGRAPhicsSTATe
FETCh Measurement Instruction
HCOPy Subsystem
IMMediate
MEASure Measurement Instruction
Read Measurement Instruction
SENSe Subsystem
DEVice ELEVations MEDium OFFSet MAGNitude
CORRectionDEVice
Constant Description NARRow
As DFB lasers and modes of FP lasers
BROad
CORRectionELEVation
0Description
Selects wavelength values in standard air
CORRectionMEDium
VACuum Selects wavelength values in a vacuum
CORRectionOFFSetMAGNitude
For 30 or 40 seconds
000,+1.48632800E+000,+1.50488300E+000
CONDition? ENABle EVENt? PTRansition NTRansition
STATus Subsystem
OPERation QUEStionableCONDition?
OPERation QUEStionableENABle
OPERation QUEStionableEVENt
OPERation QUEStionableNTRansition
OPERation QUEStionablePTRansition
18. Preset Values
SYSTem Subsystem
HEADers?
ERRor
HELPHEADers?
Can only be sent as a query
19. Instrument Conditions 1
19. Instrument Conditions 2
VERSion
20. Scpi Version Numbers
TRIGger Subsystem
ABORt
INITiateCONTinuous
INITiateIMMediate
POWer
Unit Subsystem
108
Performance Tests
Performance Tests
Calibration Cycle
Be damaged when total input power exceeds 18 dBm
Test 1. Absolute Wavelength Accuracy
Test 2. Sensitivity
Test 3. Polarization Dependence
Procedure Standard instruments flat contacting connectors
Test 4. Optical Input Return Loss
Regulatory Information
FC/APC patchcord loss
Test 5. Amplitude Accuracy and Linearity
Polarization sensitivity
Linearity = Power Meter Reading 86120C Power Reading offset
21. Linearity Data Values
Page
Specifications and Regulatory Information
Specifications and Regulatory Information
Wavelength
Definition of Terms
Amplitude
Input Power
Sensitivity
Selectivity
Maximum Number
Specifications-NORMAL Update Mode
Display resolution 001 nm
Sensitivity
Amplitude
Selectivity
Measurement Cycle Time
Input Return Loss
Measurement Applications
Specifications-FAST Update Mode
Amplitude
Fast update mode characteristic S 2 measurements-per-second
Operating Specifications
Operating Specifications
Laser Safety
Laser Safety Information
Please pay attention to the following laser safety warnings
Compliance with Canadian EMC Requirements
Acoustic Noise Emission Geräuschemission
Declaration of Conformity
Product Overview
Front view of instrument Rear view of instrument
Product Overview
Reference
22. Instrument Preset Conditions 1
Reference
22. Instrument Preset Conditions 2
Key Pressed Turned On
Menu Maps
Appl’s Menu
Display List by Power Menu
There is no menu associated with this key
Display List by WL Menu Delta On Menu
There is no menu associated with this key
System Print Menu
System Setup Menu
Error Messages
23. Instrument Specific Error Messages 1
23. Instrument Specific Error Messages 2
23. Instrument Specific Error Messages 3
24. General Scpi Error Messages 1
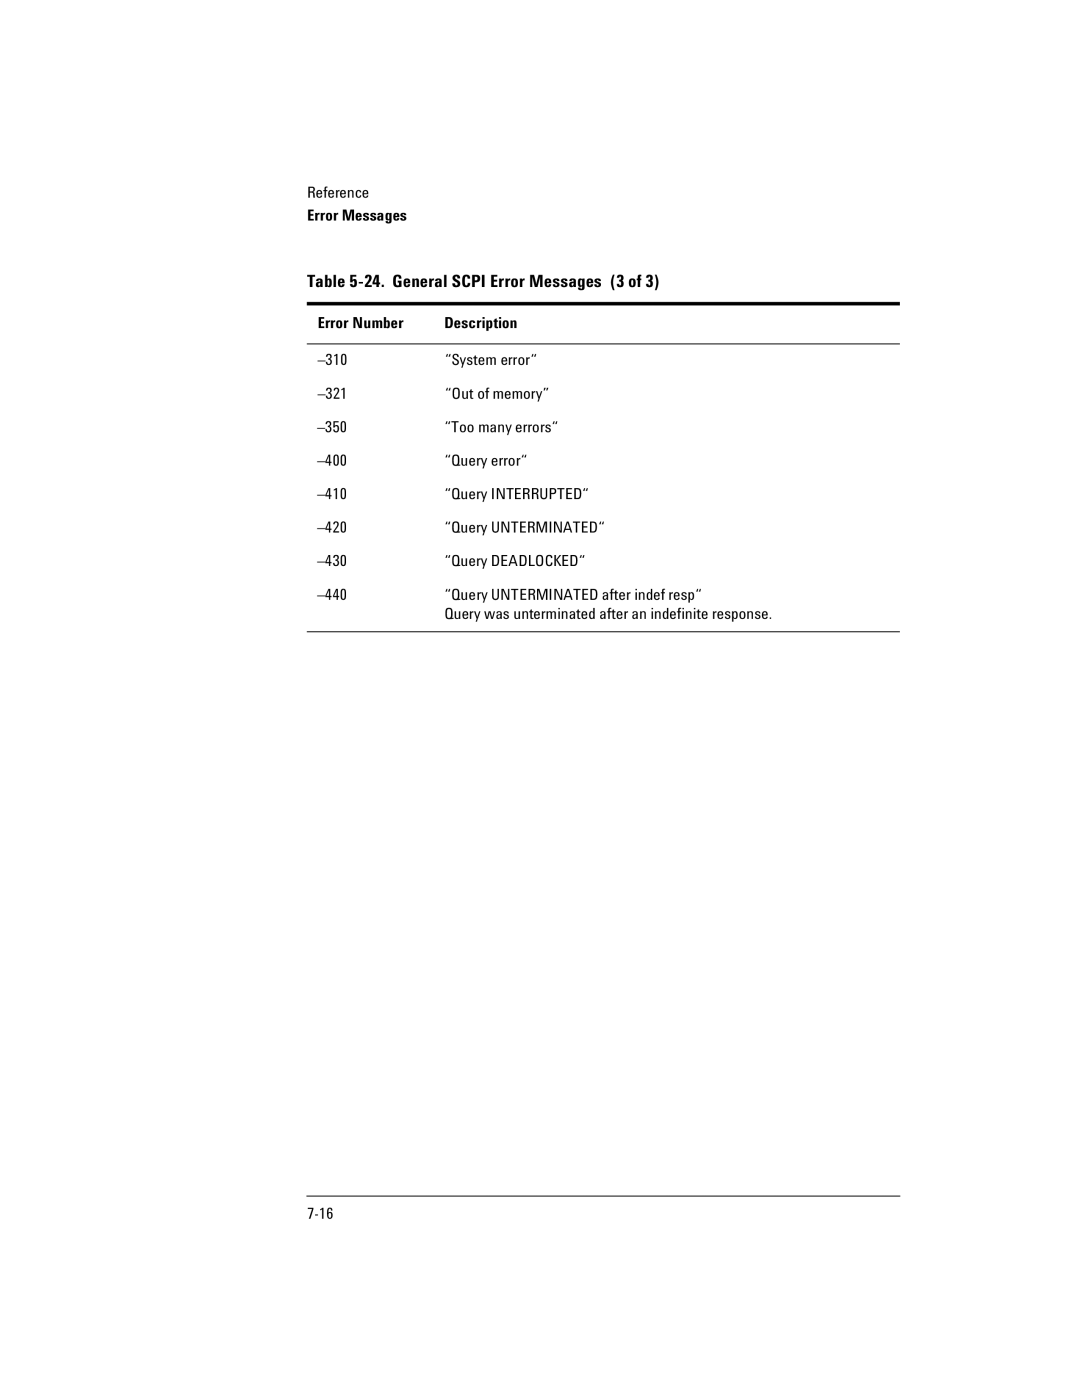
Error Number Description
24. General Scpi Error Messages 2
213 Init ignored
24. General Scpi Error Messages 3
Front-Panel Fiber-Optic Adapters
Power Cords
Agilent Technologies Service Numbers
Page
Index
Index
Index-3
Index-4
Index-5
Index-6
Index-7
Page
Page
Agilent Technologies