Management
Viewing Packet Statistics (Graph Format)
To view packet statistics in a graph format:
1 Select a port for which statistics are to be gathered by clicking on it once on the
▲Important: Statistics can be viewed at the port- level only.
2 Click PktGraph.
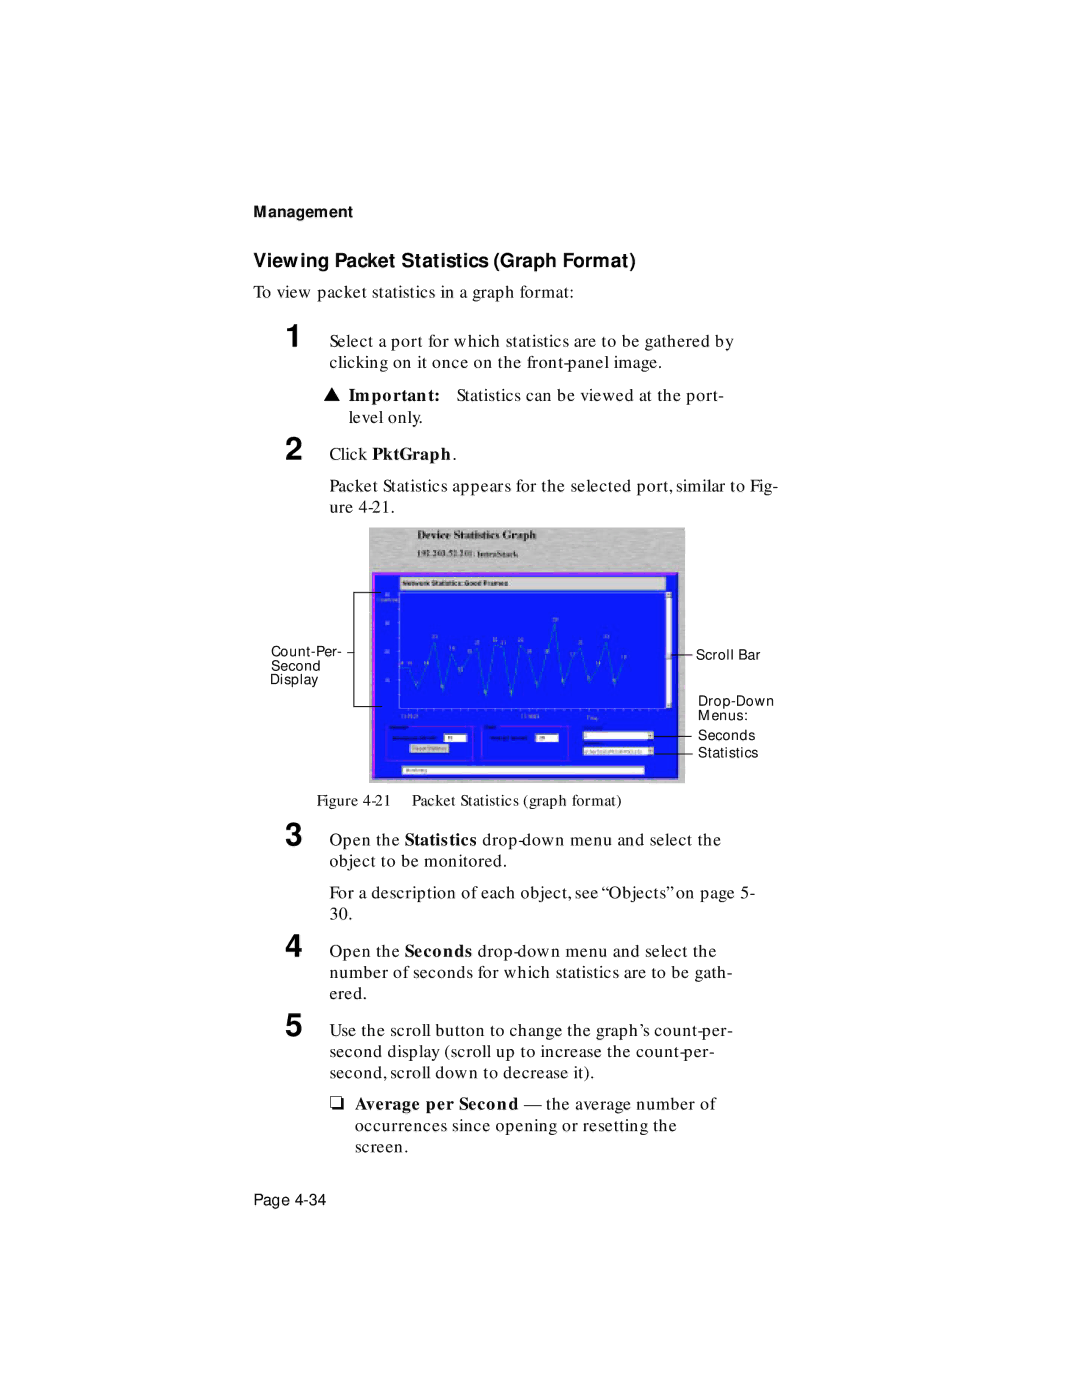
Packet Statistics appears for the selected port, similar to Fig- ure
Second
Display
Scroll Bar
Menus:
Seconds
Statistics
Figure 4-21 Packet Statistics (graph format)
3 Open the Statistics
For a description of each object, see “Objects” on page 5- 30.
4 Open the Seconds
5 Use the scroll button to change the graph’s
❏Average per Second — the average number of occurrences since opening or resetting the screen.
Page