PktGraph
PktGraph
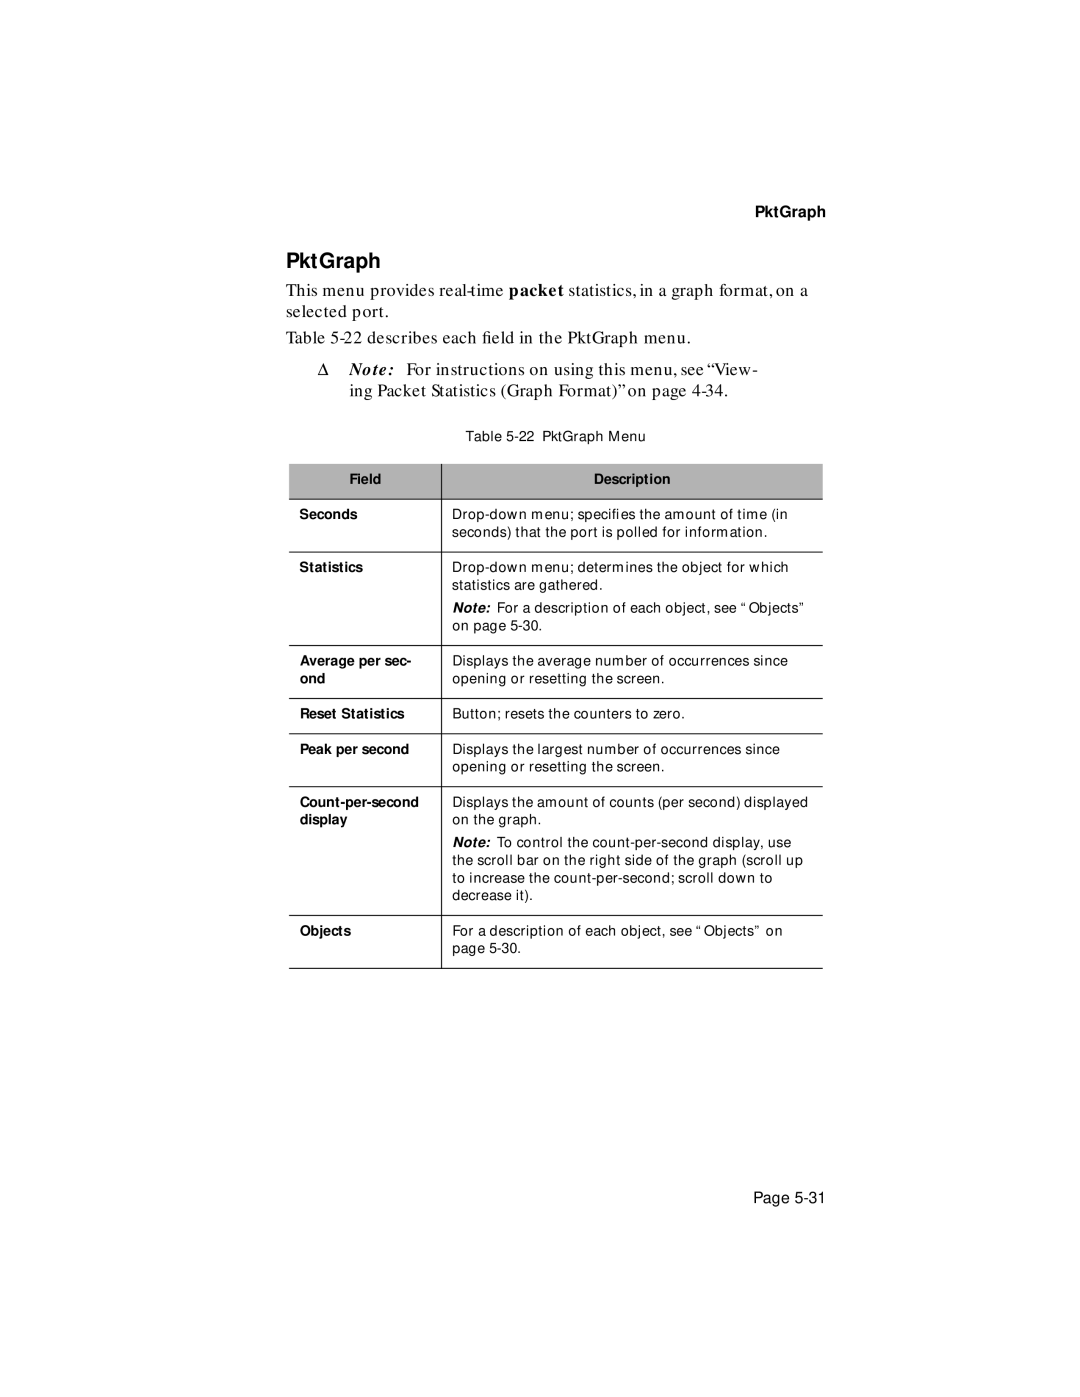
This menu provides
Table
ΔNote: For instructions on using this menu, see “View- ing Packet Statistics (Graph Format)” on page
| Table |
|
|
Field | Description |
|
|
Seconds | |
| seconds) that the port is polled for information. |
|
|
Statistics | |
| statistics are gathered. |
| Note: For a description of each object, see “Objects” |
| on page |
|
|
Average per sec- | Displays the average number of occurrences since |
ond | opening or resetting the screen. |
|
|
Reset Statistics | Button; resets the counters to zero. |
|
|
Peak per second | Displays the largest number of occurrences since |
| opening or resetting the screen. |
|
|
Displays the amount of counts (per second) displayed | |
display | on the graph. |
| Note: To control the |
| the scroll bar on the right side of the graph (scroll up |
| to increase the |
| decrease it). |
|
|
Objects | For a description of each object, see “Objects” on |
| page |
|
|
Page