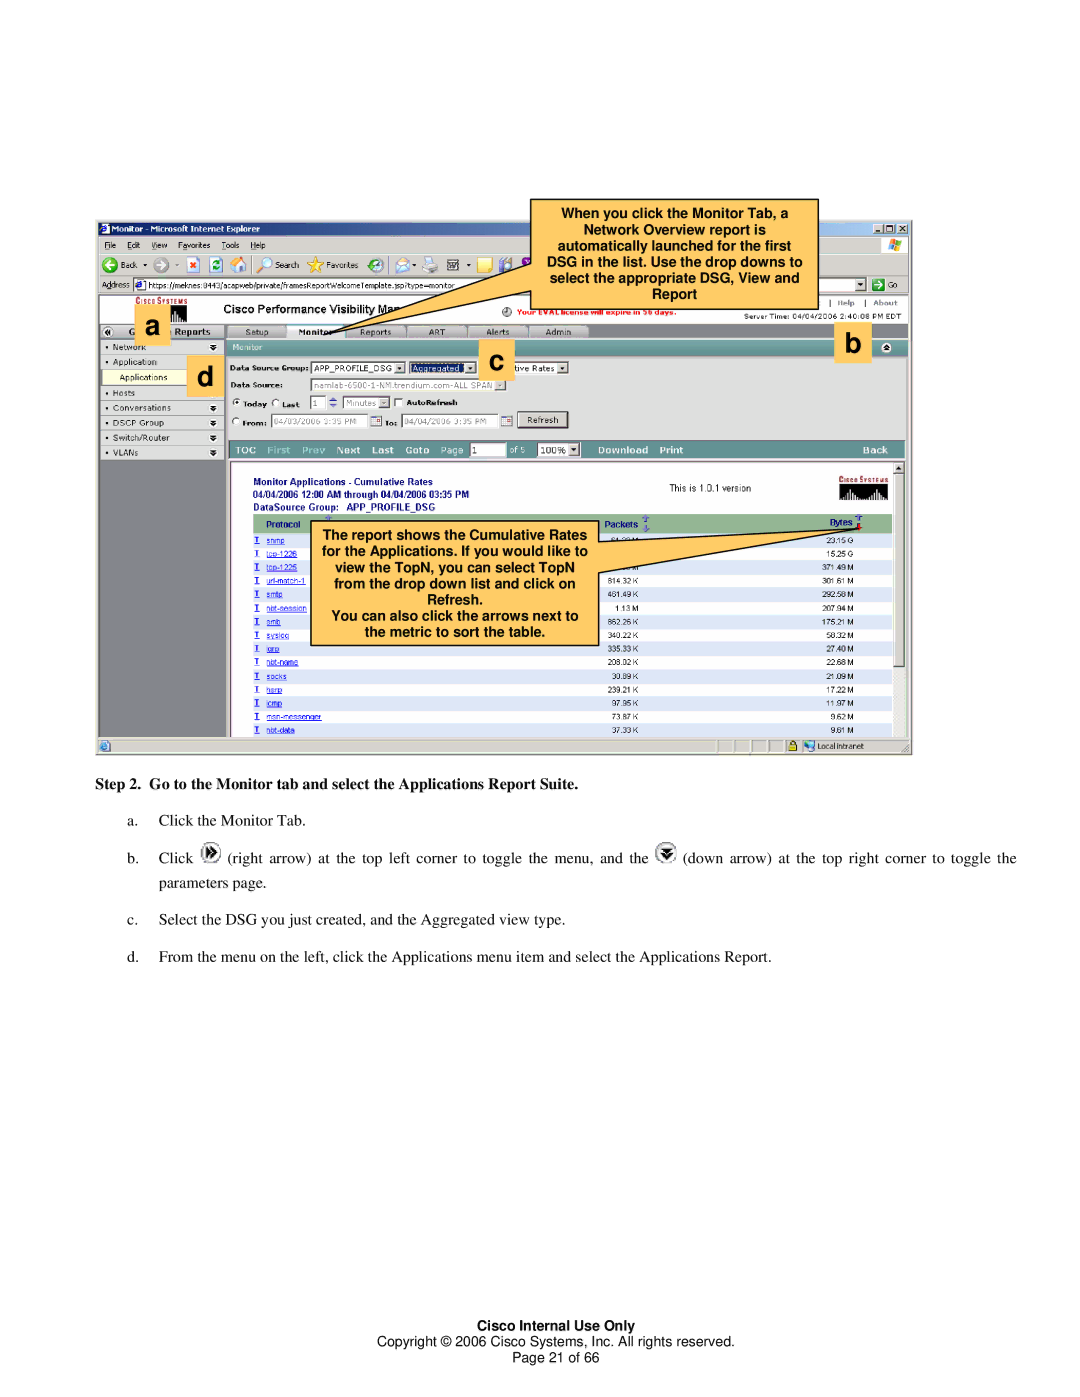
When you click the Monitor Tab, a
Network Overview report is
automatically launched for the first DSG in the list. Use the drop downs to select the appropriate DSG, View and Report
a |
|
|
|
|
|
|
|
|
|
|
| b | |
|
|
|
| c |
| |
|
|
|
|
| ||
|
| d |
|
|
| |
|
|
|
| |||
|
|
|
|
|
|
The report shows the Cumulative Rates for the Applications. If you would like to view the TopN, you can select TopN from the drop down list and click on Refresh.
You can also click the arrows next to
the metric to sort the table.
Step 2. Go to the Monitor tab and select the Applications Report Suite.
a.Click the Monitor Tab.
b.Click ![]() (right arrow) at the top left corner to toggle the menu, and the
(right arrow) at the top left corner to toggle the menu, and the ![]() (down arrow) at the top right corner to toggle the parameters page.
(down arrow) at the top right corner to toggle the parameters page.
c.Select the DSG you just created, and the Aggregated view type.
d.From the menu on the left, click the Applications menu item and select the Applications Report.
Cisco Internal Use Only
Copyright © 2006 Cisco Systems, Inc. All rights reserved.
Page 21 of 66
