Scenario 3: Troubleshooting
You are
a
b
c
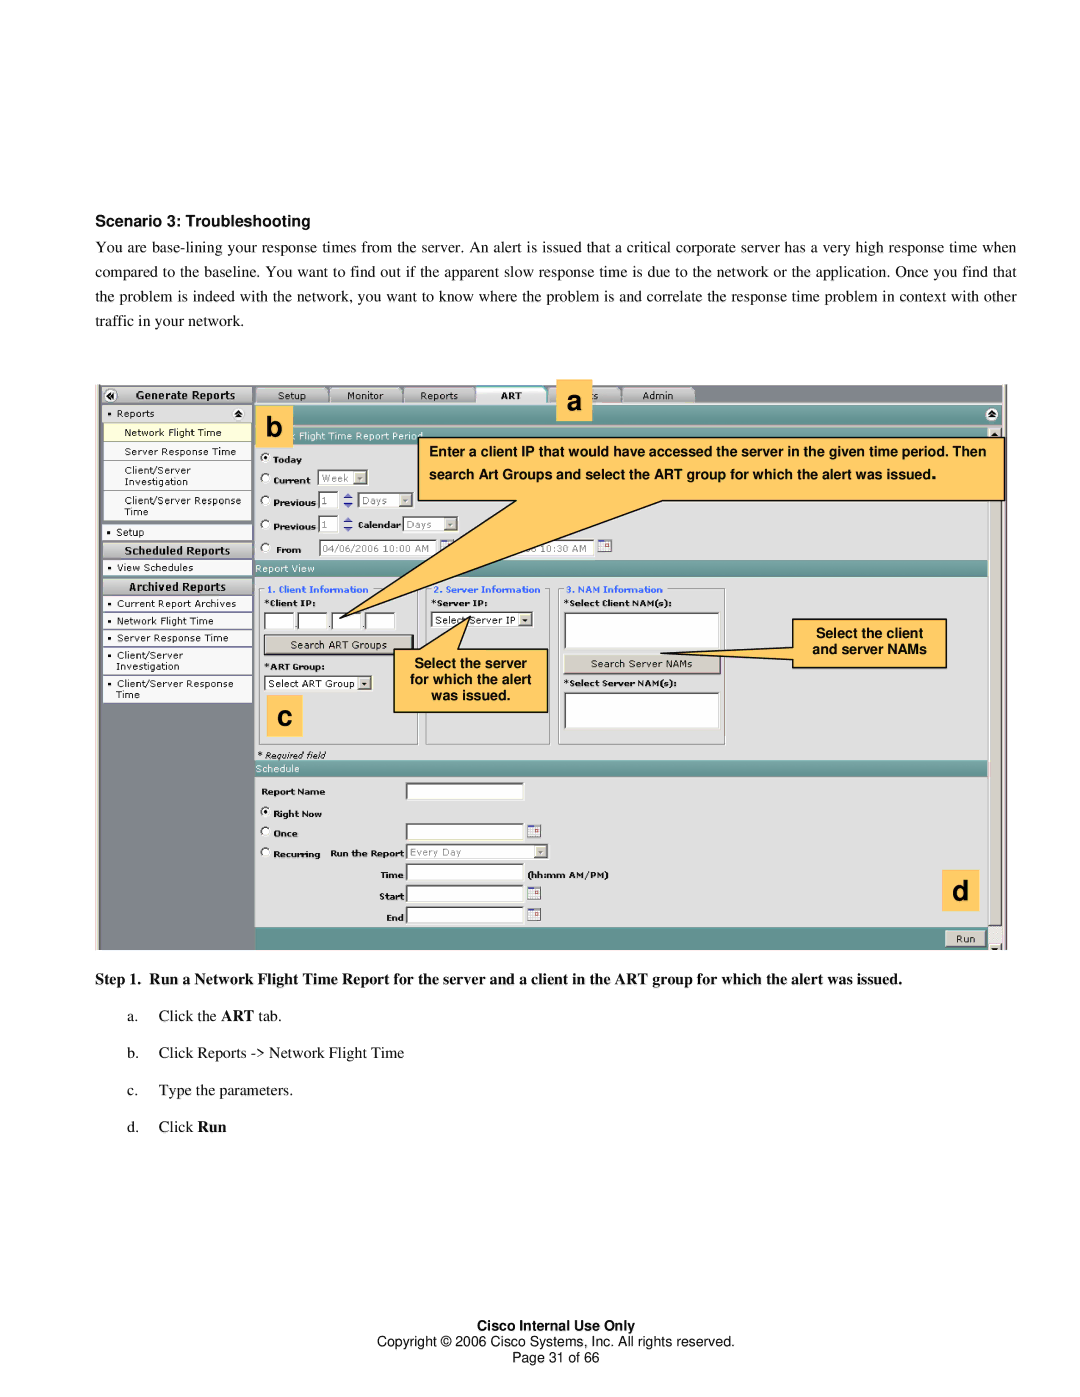
Enter a client IP that would have accessed the server in the given time period. Then search Art Groups and select the ART group for which the alert was issued.
Select the client and server NAMs
Select the server for which the alert was issued.
d
Step 1. Run a Network Flight Time Report for the server and a client in the ART group for which the alert was issued.
a.Click the ART tab.
b.Click Reports
c.Type the parameters.
d.Click Run
Cisco Internal Use Only
Copyright © 2006 Cisco Systems, Inc. All rights reserved.
Page 31 of 66