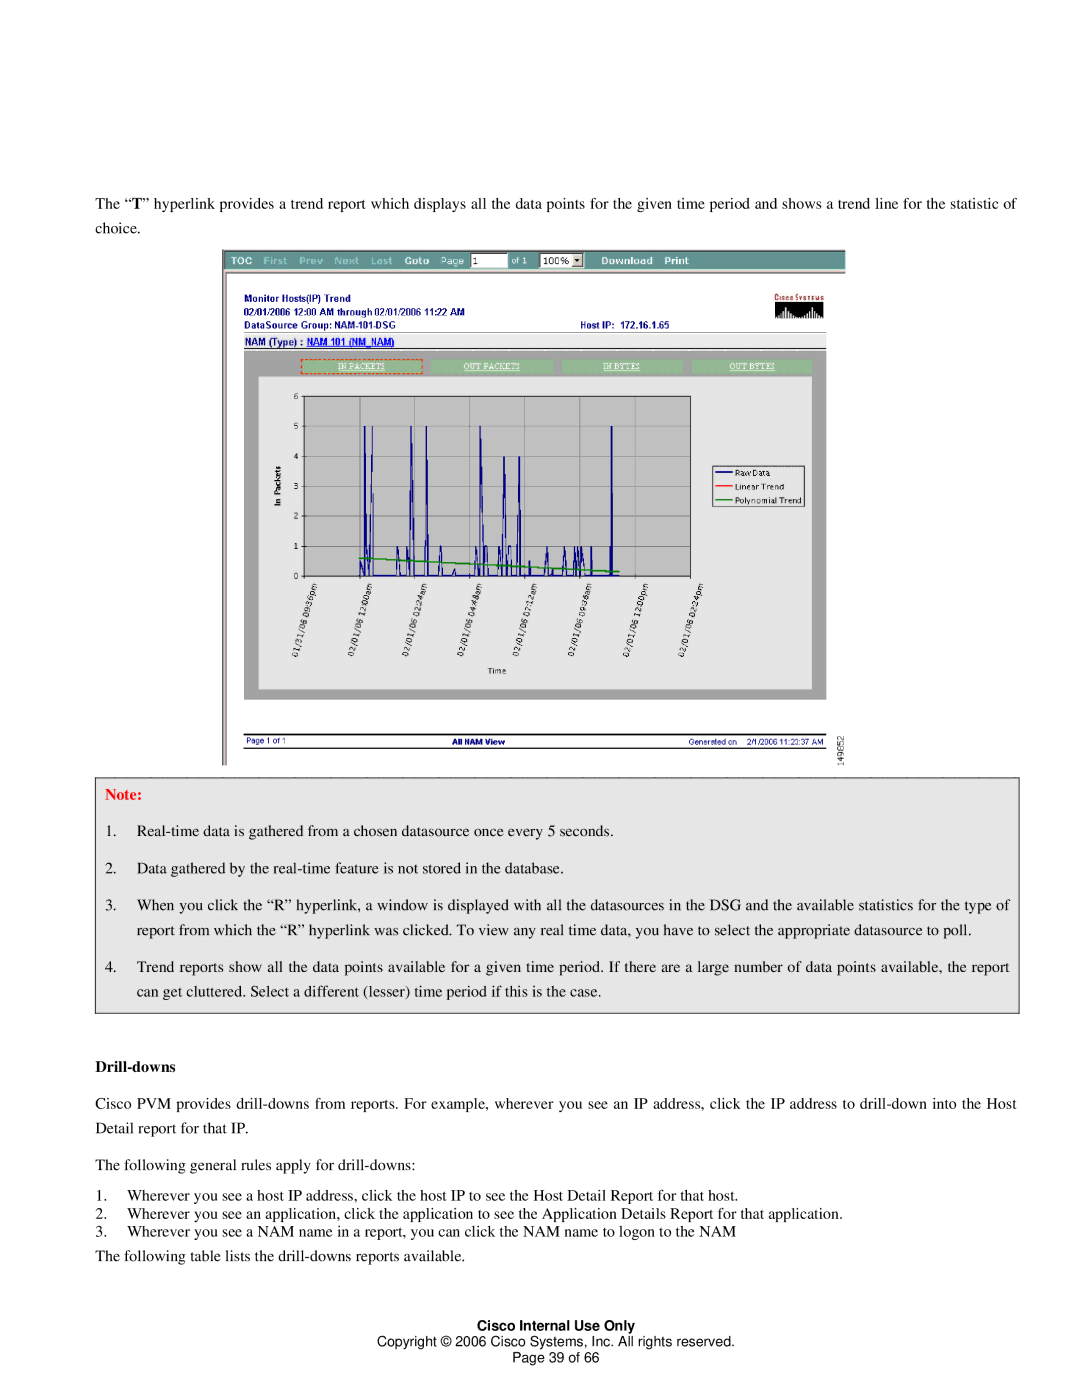
The “T” hyperlink provides a trend report which displays all the data points for the given time period and shows a trend line for the statistic of choice.
Note:
1.
2.Data gathered by the
3.When you click the “R” hyperlink, a window is displayed with all the datasources in the DSG and the available statistics for the type of report from which the “R” hyperlink was clicked. To view any real time data, you have to select the appropriate datasource to poll.
4.Trend reports show all the data points available for a given time period. If there are a large number of data points available, the report can get cluttered. Select a different (lesser) time period if this is the case.
Drill-downs
Cisco PVM provides
The following general rules apply for
1.Wherever you see a host IP address, click the host IP to see the Host Detail Report for that host.
2.Wherever you see an application, click the application to see the Application Details Report for that application.
3.Wherever you see a NAM name in a report, you can click the NAM name to logon to the NAM
The following table lists the
Cisco Internal Use Only
Copyright © 2006 Cisco Systems, Inc. All rights reserved.
Page 39 of 66
