Note:
1.You can include multiple datasources from multiple NAMs in an ART group. Select the NAM of interest from the list and then add the datasources from those NAMs to the chosen list of datasources.
2.The Report Interval parameter is an artifact of the ART MIB, which defines when the ART MIB consolidates the response time statistics and starts a new collection cycle. The default value for this parameter is 1800 seconds (30 minutes). So even if the collection cycle in Cisco PVM is set to be 5 minutes, if the report interval is set at 30 minutes, you can see reports only after 30 minutes. If you want to see ART information sooner, ensure this parameter is changed.
3.Cisco PVM creates the configurations necessary on the NAMs to monitor response times. However, these configurations do not show up in the NAM GUI. Since PVM can be deployed in multiple locations, it uses the host name of the server on which it is located when creating these configurations. Cisco NAM GUI only displays configurations created through the GUI. If you want to see the configurations created by Cisco PVM, telnet into the NAM and use the ‘show monitor art’ command.
Art Reports
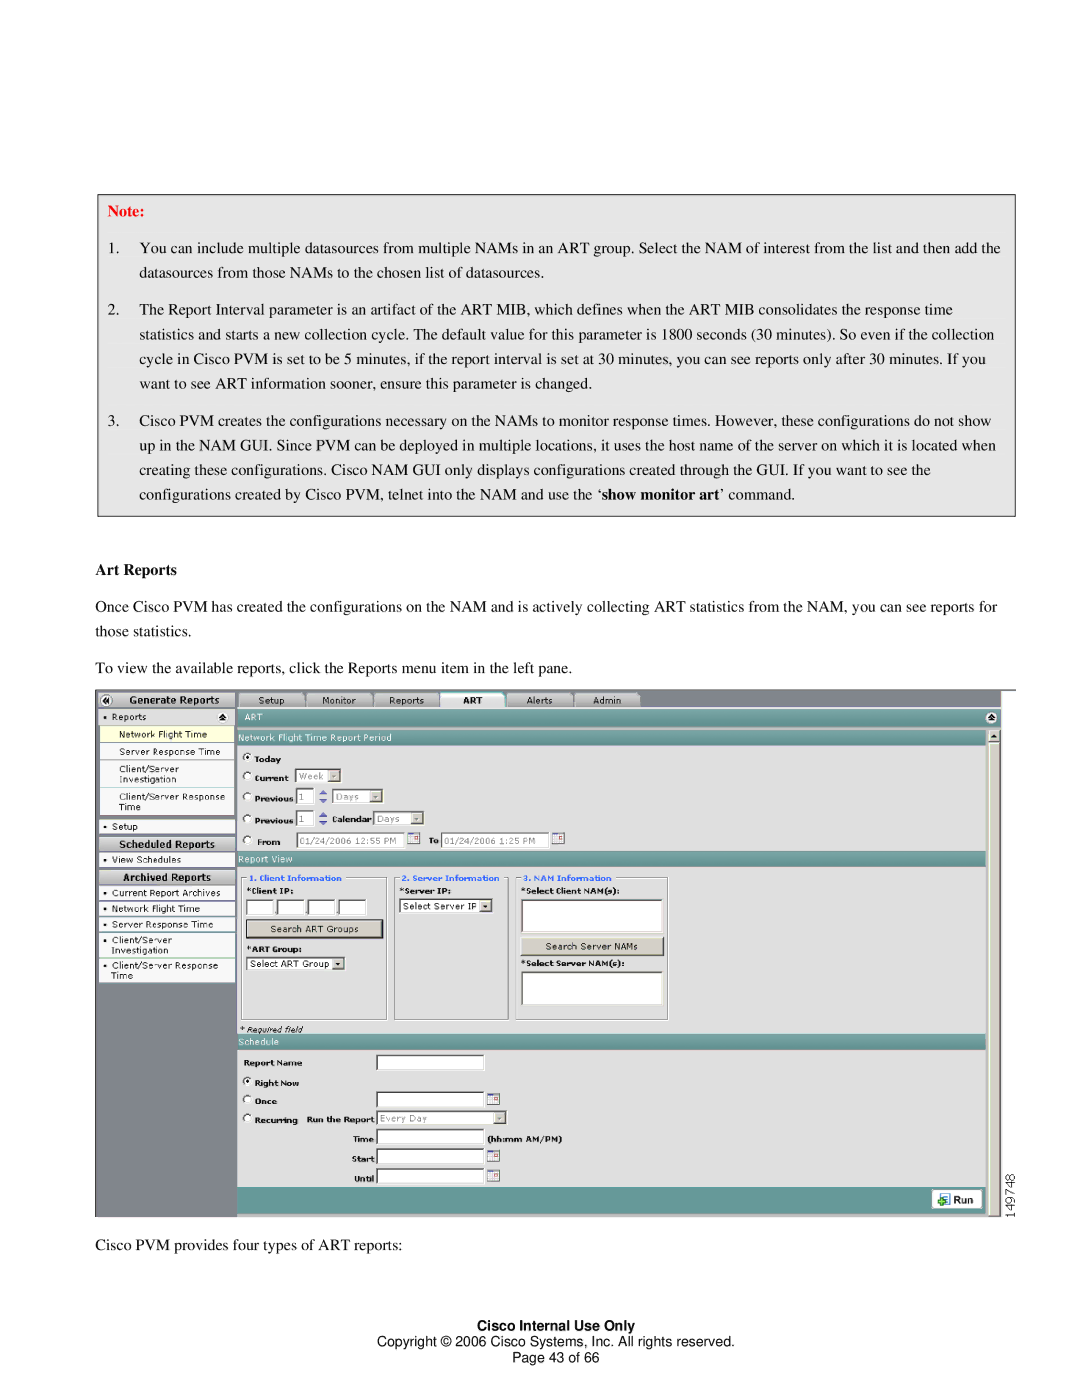
Once Cisco PVM has created the configurations on the NAM and is actively collecting ART statistics from the NAM, you can see reports for those statistics.
To view the available reports, click the Reports menu item in the left pane.
Cisco PVM provides four types of ART reports:
Cisco Internal Use Only
Copyright © 2006 Cisco Systems, Inc. All rights reserved.
Page 43 of 66
